Guide: Statistical Process Control (SPC)

Statistical Process Control (SPC) is a powerful method for monitoring and controlling process quality. Originating from manufacturing, its principles have been applied across various industries to ensure consistent product and service delivery. At its core, SPC utilizes control charts to track process performance, distinguishing between natural variations and those that warrant corrective action.

By understanding the sequence of activities in a process and collecting relevant data systematically, organizations can quickly identify deviations. This proactive approach not only aids in maintaining product quality but also fosters a culture of continuous improvement. As businesses seek to optimize their operations, the role of SPC in driving process excellence becomes even more pivotal.

Table of Contents

Step 1: Understand the Process

There are two main elements in Lean Six Sigma to gain an understanding of the process from end to end, Process Mapping and Critical to Quality (CTQ)

Process Mapping:

      • Purpose: Process mapping is the activity of creating a workflow diagram with the aim of gaining a clearer understanding of how a process works.

      • Components:
            • Activities/Steps: These are the tasks or operations carried out during the process.

            • Inputs and Outputs: Every process step has inputs (resources used) and outputs (results of the process step).

            • Flow Direction: Arrows are used to indicate the direction or flow of the process, connecting various activities.

            • Decision Points: These are points in the process where a decision is made, leading to different process paths based on the decision outcome.

        • Benefits:
              • Visibility: Allows teams to visualize the entire process, making it easier to identify bottlenecks, redundancies, and inefficiencies.

              • Standardization: Ensures that everyone has the same understanding of how the process should operate.

              • Foundation for Improvement: Provides a baseline from which process improvements can be identified and implemented.

        Critical to Quality (CTQ):

            • Purpose: CTQs are elements that are critically important to meet customer needs and expectations. They serve as a bridge between customer needs and process outputs.

            • Identification: This involves translating broad customer needs (e.g., “I want a durable product”) into specific, measurable characteristics (e.g., “The product should withstand 10,000 cycles of use without failure”).

            • Benefits:
                  • Focus on Priority: Ensures that the process emphasizes what’s most important to the customer.

                  • Measurement: Provides clear, actionable metrics that can be monitored and controlled.

                  • Alignment: Ensures that process improvements are aligned with customer needs and priorities.

            Step 2: Collect Data

            Before we collect data there are a few things we need to understand such as data types, sampling and consistency.

            Statistical Process Control Types of data

            Type of Data:

                • Continuous Data:
                      • Definition: This type of data can take on any value within a range and can be subdivided infinitely. It typically results from measuring.

                      • Examples: Temperature, weight, height, time, and speed.

                  • Attribute Data:
                        • Definition: This type of data is based on categories and often results from counting. It’s discrete and can only take on specific values.

                        • Examples: Number of defects on a product, number of customer complaints, or the number of failed items in a batch.

                  Sampling:

                      • Purpose: Sampling involves taking a subset of items from a larger population to draw conclusions about the whole population without examining every single item.

                      • Considerations:
                            • Sample Size: The number of items in a sample. A larger sample size generally provides more accurate results, but it’s also more time-consuming and costly.

                            • Sampling Frequency: How often samples are taken. Frequent sampling provides more data points, enabling quicker detection of changes in the process.

                            • Random Sampling: Ensure that the method of selecting samples doesn’t introduce bias.

                      Consistency:

                          • Purpose: Consistent data collection methods ensure that variations in the data are due to the process itself and not due to the way data is collected.

                          • Standardized Forms/Tools: Use standardized forms or electronic tools to capture data. This ensures that everyone collects data in the same way.

                          • Training: Train individuals who are collecting data to ensure they understand how to do it correctly and consistently.

                          • Review: Periodically review the data collection methods and make adjustments as necessary to ensure consistency.

                        Step 3: Choose the Appropriate Control Chat

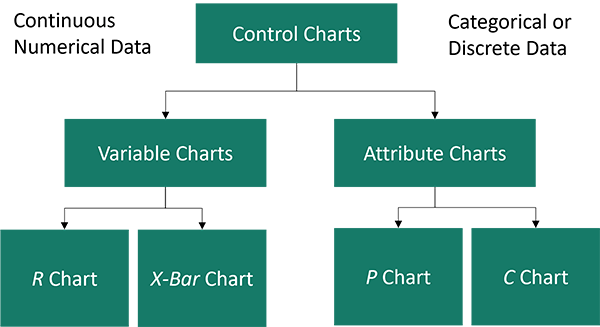
                        When it comes to control charts there is not a one size fits all, so it is important to understand what types of data you have to select the correct chart for SPC

                        Selection Criteria:

                            • Type of Data: The kind of data you’re collecting (continuous vs. attribute) largely dictates which chart is most appropriate.
                                  • Continuous Data: Results from measurements and can take any value within a range (e.g., height, weight, time).

                                  • Attribute Data: Results from counting and can only take on discrete values (e.g., number of defects).

                              • Process Behavior: Decide whether you’re more interested in monitoring the central tendency of the data (its average) or its dispersion (variability).

                            Chart Types:

                                • For Continuous Data:
                                      • X-bar and R chart: Used to monitor the average and range of subgroups of data.

                                      • X-bar and S chart: Monitors the average and standard deviation of subgroups.

                                  • For Attribute Data:
                                        • p-chart: Monitors the proportion of defective items in a sample.

                                        • np-chart: Tracks the number of defectives in a sample.

                                        • c-chart: Monitors the number of defects per unit of item.

                                        • u-chart: Tracks the number of defects per unit of measurement (e.g., per meter of cloth).

                                    • Choosing the Right Chart: Each chart provides different insights. For example, while an X-bar chart reveals shifts in the process average, a range (R) chart can indicate changes in process variability.

                                  Step 4: Determine Control Limits:

                                  By choosing the appropriate control chart and determining accurate control limits, practitioners can effectively monitor processes and detect variations that may signify issues or opportunities for improvement. For someone new to statstical control that could be difficult to calculate and understand as explained below. However, to support this we have developed our unique control chart tools so that even a beginner can upload data and gain a clear understanding the control chart and what warning signals to look out for.

                                  a. Standard Deviation:

                                      • Definition: Standard deviation is a measure of how spread out the values in a data set are around the mean. A smaller standard deviation indicates that the data points are closer to the mean, while a larger one shows that data points are spread out over a larger range of values.

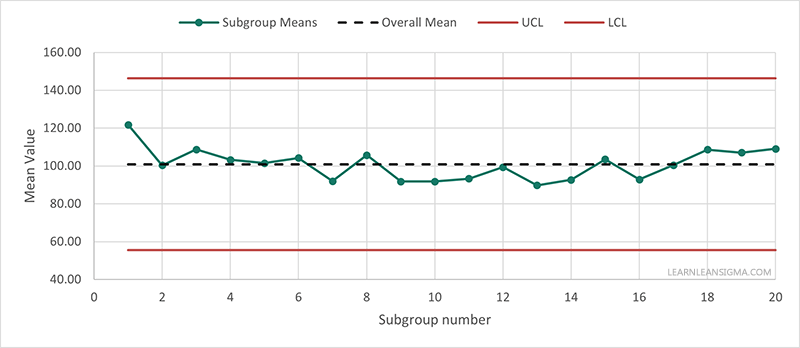
                                      • Three Sigma Limits: In control charts, it’s common practice to use three standard deviations above and below the mean as the control limits. This encompasses approximately 99.73% of the data points if the data follows a normal distribution.

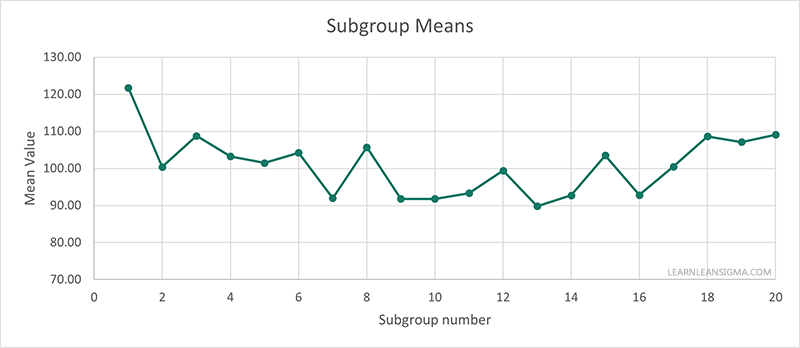
                                    The output of a chart would look similar to the below example

                                    Statistical Process Control SPC Control Chart

                                    Calculation:

                                        • Historical Data: The first step is to use historical process data to calculate the mean (μ) and standard deviation (σ) of the process.

                                        • Upper Control Limit (UCL): Typically calculated as μ+3σ. This means that if the process is under control, you’d expect about 99.73% of all data points to fall below this limit.

                                        • Lower Control Limit (LCL): Typically calculated as μ−3σ. Similarly, you’d expect about 99.73% of all data points to be above this limit if the process is stable.

                                        • Adjustments: Sometimes, based on the type of control chart and specific conditions, the formulas for control limits might vary slightly. For example, the formula for the UCL of an R chart is different from that of an X-bar chart.

                                      Step 5: Plot Data on the Statistical Process Control Chart:

                                      Plotting Data Points:

                                          • Real-time Monitoring: As new data is collected from the process, each data point is plotted on the control chart in the order it was collected.

                                          • Axes: The vertical axis (Y-axis) typically represents the measurement scale of the data, while the horizontal axis (X-axis) represents the order or time the data was collected.

                                          • Control Limits: The previously determined Upper Control Limit (UCL) and Lower Control Limit (LCL) are drawn as horizontal lines across the chart. The process mean is also plotted as a central line.

                                        Connecting Data Points:

                                            • Purpose: Connecting consecutive data points with a line helps in visualizing the flow and trend of the data over time.

                                            • Trends and Shifts: By examining the line, one can easily identify upward or downward trends, shifts, or sudden spikes/dips in the process.

                                          Step 6: Analyze the Control Chart:

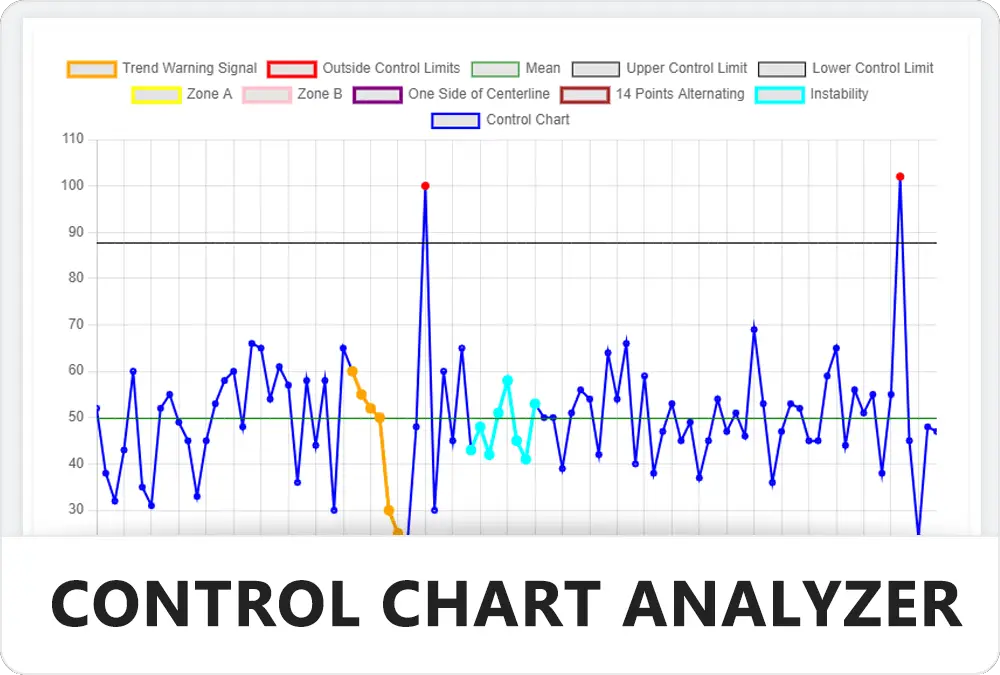
                                          A key output of creating a control chart it to analyze and interpret the data to see if there are any issues, outliers or warning signals. Fortunately, our Free Lean Six Sigma Control Chart tools automatically process the data and provide you with a report of these issues with observations and recommendations.

                                          Points Outside the UCL or LCL:

                                              • Special Cause Variation: Data points outside these control limits are strong indicators of special cause variation, meaning that something unusual has affected the process. These are not inherent to the process and warrant an investigation.

                                              • Immediate Action: Such points are considered “out of control” signals. They typically require immediate attention to determine their root cause and take corrective action.

                                            Seven Consecutive Points Trending Up or Down:

                                                • Rule of Seven: One of the widely accepted rules in SPC states that seven or more consecutive data points all above or all below the central line (mean) suggest that the process is not just fluctuating randomly but may be experiencing a systematic change.

                                                • Potential Causes: Such trends could be due to tool wear in a manufacturing setting, a gradual increase in demand in a service setting, or other systematic factors that cause the process mean to drift.

                                              Non-random Patterns:

                                                  • Cycles: If the data exhibits a repeating pattern or cycle, this suggests that there is a periodic factor influencing the process. For instance, a manufacturing process might show cyclical variation due to a machine that heats up and cools down periodically.

                                                  • Repeating Patterns: Patterns that repeat but are not cyclical can indicate factors such as batch-to-batch variability or effects of shift changes.

                                                  • Clusters: If data points cluster in certain areas and are absent in others, it may indicate multiple modes in the process or intermittent system disturbances.

                                                  • Other Patterns: There are other rules and patterns that practitioners watch for, such as alternating up and down points, two out of three points near a control limit, etc. Each of these patterns can indicate different potential issues in the process.

                                                Step 7: Investigate Causes of Variation:

                                                Investigation Process:

                                                    • Root Cause Analysis: This involves delving deep into the process to identify the underlying reasons for observed variations. Common tools used include the “5 Whys” technique, Fishbone (Ishikawa) diagrams, and Pareto analysis.

                                                    • Engage Process Experts: Collaboration with those who work directly with the process often provides invaluable insights. They can often provide context or observations that may not be immediately evident from the data alone.

                                                    • Data Collection: Sometimes, further data might need to be collected to pinpoint the cause, especially if the initial data set is limited or lacks granularity.

                                                  Common Cause vs. Special Cause Variation:

                                                      • Common Cause Variation:
                                                            • Definition: These are the inherent variations in any process due to the usual, natural, and expected sources of variability. They are sometimes called “noise.”

                                                            • Action: Common causes do not typically warrant special action or intervention. Instead, they might require a systematic approach to process improvement or redesign.

                                                        • Special Cause Variation:
                                                              • Definition: These are unexpected variations in the process, arising from specific, identifiable events or changes. They are sometimes referred to as “signals.”

                                                              • Action: Special causes require immediate investigation and action, as they indicate that the process is not stable or predictable.

                                                        Step 8: Implement Corrective Actions:

                                                        a. Action Plan:

                                                            • Prioritize: If multiple special causes are identified, prioritize them based on their impact on the process and the ease of implementation.

                                                            • Develop Solutions: Solutions could range from simple fixes (e.g., adjusting a machine setting) to more complex interventions (e.g., retraining staff or redesigning a part of the process).

                                                            • Stakeholder Involvement: Ensure that all relevant parties are involved in developing and approving corrective actions. This promotes buy-in and ensures that the proposed solutions are feasible.

                                                          Implementation:

                                                              • Documentation: Document the identified causes, proposed corrective actions, and the rationale behind them. This ensures transparency and provides a record for future reference.

                                                              • Execute: Carry out the corrective actions as planned. This might involve changes in the process, training, equipment adjustments, or other interventions.

                                                              • Monitor the Effectiveness:

                                                                • Post-Implementation Data Collection: Continue collecting data after implementing corrective actions. This helps in assessing whether the actions have effectively addressed the special cause variations.

                                                                • Feedback Loop: If the corrective actions do not yield the desired results, it’s crucial to revisit the analysis, possibly identifying other causes or refining the implemented solutions.

                                                                • Continuous Monitoring: Even after the immediate issues are addressed, continue to monitor the process using control charts to ensure its stability over time.

                                                              Step 9: Review and Adjust Control Limits:

                                                              Need for Adjustment:

                                                                  • Process Changes: If there are significant changes in the process, such as the introduction of new equipment or a change in materials, it might alter the process’s inherent variability, necessitating a revision of control limits.

                                                                  • Process Improvements: As you make deliberate improvements to a process, its performance characteristics might change. For instance, efforts to reduce variability could result in tighter data clusters, suggesting new control limits.

                                                                Recalculation:

                                                                    • Using New Data: To adjust control limits, collect a new set of data from the stabilized or improved process. Then, calculate the mean and standard deviation of this new data set.

                                                                    • Setting New Limits: Typically, the new Upper Control Limit (UCL) and Lower Control Limit (LCL) are set at three standard deviations above and below the new mean, respectively, though the exact number can vary based on the specific control chart type and industry standards.

                                                                  Documentation:

                                                                      • Rationale: Always document the reasons for adjusting control limits. This provides a historical record and ensures that stakeholders understand the basis for changes.

                                                                      • Version Control: If you’re using electronic control charts, it’s good practice to maintain versions to track changes over time.

                                                                    Step 10: Maintain the Control Chart:

                                                                    Ongoing Monitoring:

                                                                        • Consistency: Even if a process appears stable and in control, it’s essential to maintain vigilance. Regularly adding new data to the control chart ensures you can detect any shifts or drifts promptly.

                                                                        • Frequency: The frequency of data addition will depend on the nature of the process and the criticality of what’s being monitored. Some processes might require daily monitoring, while others could be weekly or even monthly.

                                                                      Updating with New Data:

                                                                          • Real-Time Updates: In some advanced manufacturing settings, control charts can be updated in real-time using sensors and automated data collection systems.

                                                                          • Manual Entry: In other scenarios, data might be collected manually and then entered into the control chart at specific intervals.

                                                                        Periodic Review:

                                                                            • Trend Analysis: Over longer periods, even if individual data points don’t signal immediate alarms, you might start to notice longer-term trends or patterns, suggesting more gradual changes in the process.

                                                                            • Stakeholder Engagement: Periodically review the control chart with key stakeholders. This not only keeps them informed but also can lead to insights or observations from different perspectives.

                                                                            • Review Triggers: Set specific triggers for reviews, such as after a set number of data points, after a certain time period, or post major process changes.

                                                                          Conclusion

                                                                          In the world of quality assurance, Statistical Process Control stands as a beacon of proactive management. By continuously monitoring processes and analyzing performance data, organizations can preemptively address issues before they escalate. The distinction between common and special causes of variation is vital, ensuring resources are directed appropriately. Moreover, as processes evolve, the periodic recalibration of control limits ensures that the monitoring tools remain relevant. Ultimately, the success of SPC hinges on a blend of rigorous data analysis and human insight. When implemented effectively, it not only guarantees product and service consistency but also instills a culture where continuous improvement becomes an organizational norm, leading to long-term success and sustainability.

                                                                          References

                                                                          Additional Useful Information on Statistical Process Control (SPC)

                                                                          CUSUM Charts: A Specialized SPC Tool

                                                                          Cumulative Sum Control Charts (CUSUM) are an extension of basic control charts, designed to detect and monitor change more effectively. They are especially useful for detecting small shifts in process averages that traditional Shewhart X-bar charts might overlook.

                                                                          Variants of SPC

                                                                          1. EWMA (Exponentially Weighted Moving Average): EWMA charts place more weight on recent data and can be more sensitive to shifts than traditional control charts.

                                                                          2. P-Control and NP-Control Charts: These are used for attribute data where the output is categorized into ‘good’ or ‘bad,’ or ‘pass’ or ‘fail.’

                                                                          Integration with Other Tools

                                                                          1. FMEA (Failure Modes and Effects Analysis): SPC data can be used in FMEA to quantify the risk and effectiveness of different failure modes.

                                                                          2. Root Cause Analysis: SPC charts can be used in conjunction with tools like Fishbone Diagrams to identify root causes of process variation.

                                                                          Real-time Monitoring and Digital Tools

                                                                          In today’s data-rich environments, SPC can be automated for real-time monitoring. Software tools can automatically collect data, plot control charts, and send alerts if abnormal patterns are detected. These digital solutions can be invaluable in large-scale or complex operations.


                                                                          Importance in Various Sectors

                                                                          SPC isn’t just for manufacturing anymore. Its applications have spread to:

                                                                          1. Healthcare: For monitoring patient wait times or the effectiveness of treatments.

                                                                          2. Finance: In algorithmic trading or fraud detection.

                                                                          3. Logistics: For optimizing route planning and warehouse stocking.

                                                                          Tips for Effective Implementation

                                                                          1. Employee Training: Ensure that all relevant staff understand how to read and interpret control charts.

                                                                          2. Data Integrity: Consistently review the data input into the SPC charts to ensure it’s accurate and relevant.

                                                                          A: SPC is a method used to monitor, control, and improve processes by analyzing performance data to identify and eliminate unwanted variations.

                                                                          A: SPC helps ensure processes are consistent and predictable. It aids in early detection of issues, reducing defects, and improving overall product or service quality.

                                                                          A: A control chart is a graphical representation used in SPC to plot process data over time, with control limits that help distinguish between common and special cause variations.

                                                                          A: Control limits are typically set at three standard deviations above and below the process mean, based on historical data. However, these limits can be adjusted depending on the specific chart type and industry standards.

                                                                          A: Common cause variation is the inherent variability in a process, while special cause variation arises from specific, unusual events and is not part of the normal process.

                                                                          Author

                                                                          Daniel Croft

                                                                          Daniel Croft

                                                                          Daniel Croft is a seasoned continuous improvement manager with a Black Belt in Lean Six Sigma. With over 10 years of real-world application experience across diverse sectors, Daniel has a passion for optimizing processes and fostering a culture of efficiency. He's not just a practitioner but also an avid learner, constantly seeking to expand his knowledge. Outside of his professional life, Daniel has a keen Investing, statistics and knowledge-sharing, which led him to create the website learnleansigma.com, a platform dedicated to Lean Six Sigma and process improvement insights.

                                                                          All Posts

                                                                          Download Template

                                                                          Free Lean Six Sigma Templates

                                                                          Improve your Lean Six Sigma projects with our free templates. They're designed to make implementation and management easier, helping you achieve better results.

                                                                          Other Guides