What is an OEE

Guide: Overall Equipment Effectiveness (OEE)

Author's Avatar

Daniel Croft

Daniel Croft is an experienced continuous improvement manager with a Lean Six Sigma Black Belt and a Bachelor's degree in Business Management. With more than ten years of experience applying his skills across various industries, Daniel specializes in optimizing processes and improving efficiency. His approach combines practical experience with a deep understanding of business fundamentals to drive meaningful change.

Overall Equipment Effectiveness is a crucial Key Performance Indicator in the manufacturing sector, offering insights into the efficiency and effectiveness of machinery and production lines. This metric is made up of three core components: Availability, Performance, and Quality, each providing a unique lens to assess equipment’s operational success.

OEE not only aligns with the principles of Total Productive Maintenance (TPM) and Lean Manufacturing, which emphasize proactive maintenance and waste minimization but also acts as a critical link in enhancing productivity and streamlining manufacturing processes. Understanding and implementing OEE effectively can lead to significant improvements in production efficiency and equipment reliability.

Table of Contents

The Components of OEE

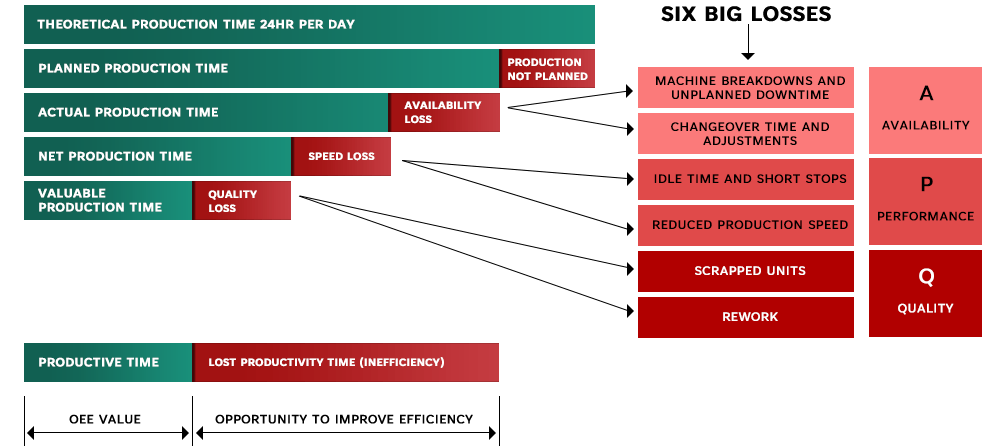
The result of an OEE calculation is the multiplication of three metrics: Availability, Performance, and Quality. Each of these elements contributes a unique input to the overall understanding of the equipment’s effectiveness.

OEE Breakdown

Availability

This metric is a measure of the uptime of equipment. It measures the amount of time the equipment is available for production against the amount of time scheduled for operations. Multiple factors can impact availability, such as equipment breakdowns, maintenance requirements, and necessary machine adjustments. Availability can be used to understand the reliability of equipment; low availability is usually associated with poorly maintained equipment. 

Performance

The Performance aspect of OEE analyzes if the equipment is operating at its optimal capacity. This is evaluated by comparing the actual cycle time (time taken to produce a single unit) with the theoretical ideal cycle time. Performance can be impacted by several factors, such as machinery operating slower than its capability and minor stoppages.

Quality

The quality metric analyzes the amount of non-defective product produced. It is calculated by dividing the number of good units by the overall number of units produced. The loss in quality can be a result of various issues, including manufacturing defects, lower yield rates, and the need for rework and repairs of defective products.

The Scenario: Widget Factory

The widget factory operates a production line scheduled to run for 8 hours a day. The ideal cycle time (the time it should take to produce one widget under perfect conditions) is 1 minute per widget.

Availability

On a particular day, the production line was scheduled to operate for 480 minutes (8 hours). However, due to a machine breakdown and routine maintenance, the line was only operational for 420 minutes.

Calculating Availability: Availability=Actual Operating TimePlanned Production Time Availability=420 minutes480 minutes=87.5%

Performance

In the 420 minutes of operation, the production line was expected to produce 420 widgets (1 widget per minute). However, due to some minor stoppages and the machine running slower than its optimal speed, only 380 widgets were produced.

Calculating Performance: Performance=Actual OutputExpected Output Performance=380 widgets420 widgets90.5%

Quality

Out of the 380 widgets produced, 30 were found to be defective and needed rework.

Calculating Quality: Quality=Good UnitsTotal Units Produced Quality=350 good widgets380 total widgets92.1%

Overall OEE Calculation

Finally, to find the OEE, we multiply these three percentages.

OEE=Availability×Performance×Quality OEE=87.5%×90.5%×92.1%

Let’s calculate the exact OEE value.

The Overall Equipment Effectiveness (OEE) for this widget factory, based on the given data, is approximately 72.93%.

This means that, taking into account the time the equipment was available, how well it performed, and the quality of the widgets produced, the factory was operating at about 72.93% of its ideal capacity. This number helps the factory identify where improvements can be made. For example, they might need to focus on reducing downtime (to improve Availability), optimizing their processes to achieve the ideal cycle time (to improve Performance), or enhancing their manufacturing process to reduce defects (to improve Quality).

OEE Calculator

Calculating OEE can be difficult if you are new to the topic, so we have developed our online OEE calculator, where you can input some basic numbers, and the calculator will output the results for you and provide feedback on what action could be taken to improve. 

Feel free to try it out.

OEE Calculator

OEE Calculator

Implementing OEE in Manufacturing

Implementing and tracking Overall Equipment Effectiveness (OEE) requires a systematic approach to data collection and measurement. 

Understanding What to Measure

Before going into data collection, it’s important to understand the three core components of OEE:

  1. Availability: Measures how often equipment is available versus the planned production time.
  2. Performance: Assesses if the equipment is running at its optimal speed.
  3. Quality: Looks at the proportion of good products versus the total produced.

Step 1: Setting Up for Data Collection

Identify Data Points

  • For Availability: Track planned production time and downtime (including reasons for downtime like maintenance, breakdowns, or setup time).
  • For Performance: Record the actual number of units produced and compare it with the theoretical output if the machine were running at optimal speed.
  • For Quality: Count the number of good units and the total units produced, including those that are defective or require rework.

Choose Your Tools

  • Manual Logging: For smaller operations, manual logging using forms or spreadsheets may suffice.
  • Automated Systems: Larger or more technologically advanced facilities might opt for sensors and software that automatically track and log data such as PLC and SCADA.

Step 2: Data Collection Process

Implement a consistent routine for collecting data. Decide on a regular interval for data collection that suits the pace of the business; it could be shift-wise, daily, or hourly, depending on your operation’s scale. Ensure that the data is collected in the same way each time to maintain consistency. This will be important when analyzing data over time to understand changes in terms of up trends and downtrends, but also the impact of changes and improvements to processes and how this impacts OEE.

Train Your Team

Make sure all relevant staff are trained in how and what data to collect if it is a manual data collection process. Provide clear, written instructions and guidelines for data collection. If this is an automated process, ensure that the equipment will be able to collect the data reliably and consistently for the output results.

Step 3: Measuring and Calculating OEE

Availability

Availability=(Actual Operating TimePlanned Production Time)×100%

Performance

Performance=(Total Count of Units ProducedTotal Count Possible at Optimal Speed)×100%

Quality

Quality=(Number of Good UnitsTotal Units Produced)×100%

Overall OEE

OEE=Availability×Performance×Quality

Step 4: Recording and Reviewing Data

Keep a record of all data collected in an organized manner. Regularly review the data to identify trends, patterns, or areas of concern. This will likely be part of the role of a production manager to review and report the KPI of OEE and any impacts on OEE in a given period of time.

Step 5: Continuous Improvement

Use the data to make informed decisions about improvements in processes or equipment. Remember, OEE tracking is an ongoing process. Regularly revisit and refine your data collection methods based on what you learn.

This simple guide serves as a starting point for implementing OEE in your manufacturing process. It’s important to adapt and modify this approach based on the specific needs and scale of your operation. Remember, the key to effective OEE implementation is consistency, accuracy, and a commitment to continuous improvement.

Conclusion

In conclusion, OEE serves as a key tool in the manufacturing , providing a comprehensive measure of equipment effectiveness through its core components of Availability, Performance, and Quality. Implementing OEE involves a systematic approach, beginning with precise data collection, followed by thorough analysis and the derivation of actionable insights.

Training and creating a culture of continuous improvement are fundamental to this process, as is the need for ongoing monitoring and adaptation. As a result, OEE not only guides manufacturers in pinpointing inefficiencies but also plays a pivotal role in continuous improvement and decision-making, driving towards optimal production efficiency and quality.

References

A: OEE stands for Overall Equipment Effectiveness. It is a performance metric used to measure the efficiency and effectiveness of equipment or machinery in manufacturing and industrial processes.

A: OEE is calculated by multiplying three factors: Availability, Performance, and Quality. The formulas are as follows:

  • Availability = (Operating Time / Planned Production Time) * 100
  • Performance = (Actual Output / Maximum Possible Output) * 100
  • Quality = (Good Units / Total Units Produced) * 100
  • OEE = Availability × Performance × Quality

A: Each factor of OEE represents a different aspect of equipment performance:

  • Availability: Measures the actual operating time of the equipment compared to the planned production time.
  • Performance: Measures how well the equipment is running compared to its maximum potential output.
  • Quality: Represents the ratio of good-quality products produced by the equipment to the total products manufactured.

A: A perfect OEE score is 100%, indicating that the equipment is operating at maximum efficiency and effectiveness. However, achieving 100% is often difficult. In general, a good OEE score varies by industry and specific processes, but a score above 85% is considered quite good.

A: OEE provides valuable insights into equipment performance, identifies areas for improvement, and helps optimize manufacturing operations. It highlights inefficiencies, such as downtime, speed losses, and quality issues, enabling organizations to take targeted actions to improve productivity, reduce costs, and enhance overall equipment effectiveness.

Author

Picture of Daniel Croft

Daniel Croft

Daniel Croft is a seasoned continuous improvement manager with a Black Belt in Lean Six Sigma. With over 10 years of real-world application experience across diverse sectors, Daniel has a passion for optimizing processes and fostering a culture of efficiency. He's not just a practitioner but also an avid learner, constantly seeking to expand his knowledge. Outside of his professional life, Daniel has a keen Investing, statistics and knowledge-sharing, which led him to create the website learnleansigma.com, a platform dedicated to Lean Six Sigma and process improvement insights.

All Posts

OEE Calculator

Free Lean Six Sigma Templates

Improve your Lean Six Sigma projects with our free templates. They're designed to make implementation and management easier, helping you achieve better results.

Other Guides