Loading...
I-MR Chart (Individual & Moving Range Control Chart)
Results
Mean:
Standard Deviation:
Variance:
Range:
Median:
Mode:
Upper Control Limit:
Lower Control Limit:
Percentage within Limits: %
Count of Warning Signals:
Feedback
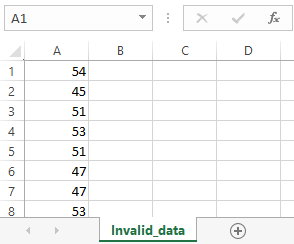
Data Validation Error
Uploaded data contains invalid values. Please upload a valid CSV or XLSX with numerical values.
Example of correct format: