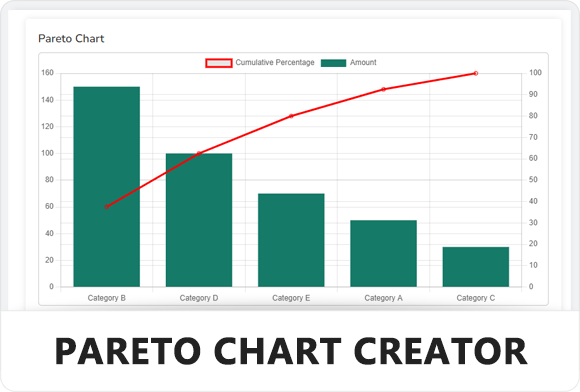
Pareto Chart Creator
Pareto Analysis Tool Upload Input Manual Input Add More Submit Data Pareto Chart Export Chart
Pareto Analysis Tool Upload Input Manual Input Add More Submit Data Pareto Chart Export Chart

Upload or Input Data for Histogram Enter data separated by commas: Upload a .csv or .xlsx file: Generate Histogram Demo Data Histogram Feedback Looking to delve deep into your data? You’re in the right place!…

Calculate the P-Value P-Value Calculator and Visualiser P-Value Analysis quicker than you can Google “How to calculate P-value in Excel” Sample Mean (x̄): ? Population Mean (μ): ? Standard Deviation (σ): ? Sample Size (n):…
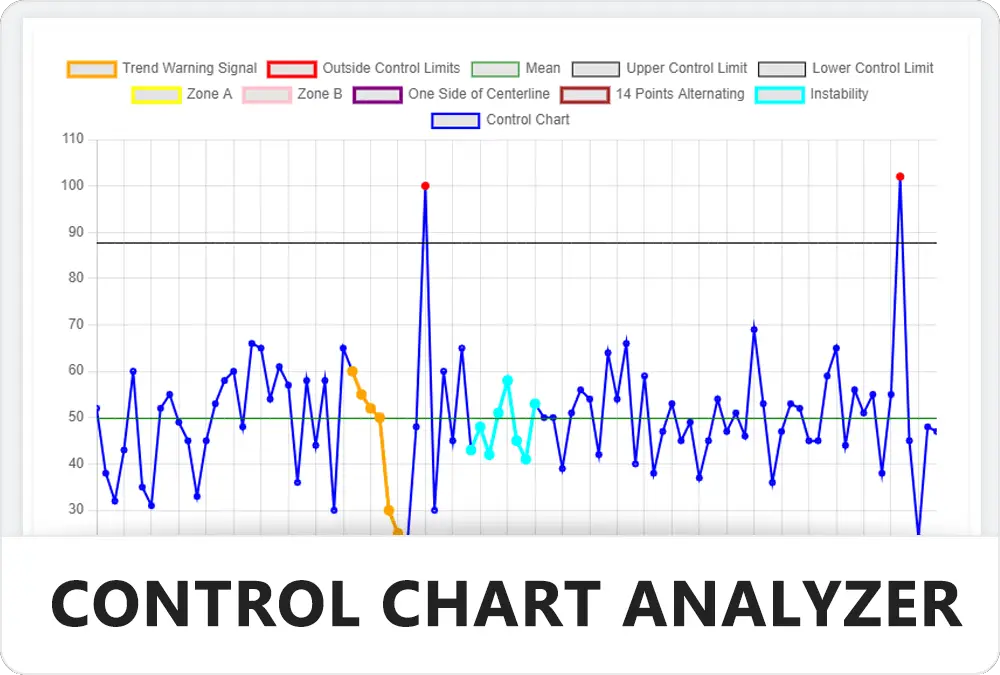
Loading… Load Data Demo Reset I-MR Chart (Individual & Moving Range Control Chart) Export to PDF Export as Image – Results Mean: Standard Deviation: Variance: Range: Median: Mode: Upper Control Limit: Lower Control Limit: Percentage…
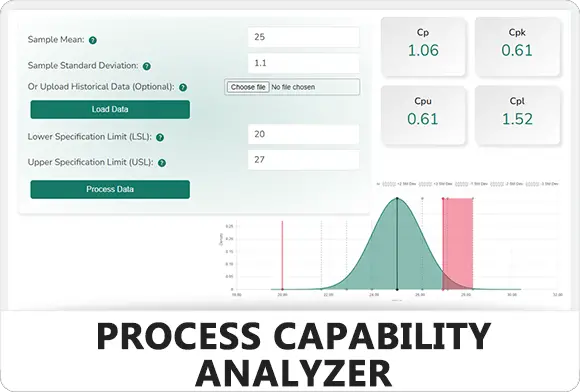
Analyze your Processes Process Capability and Data Analysis Process Capability Analysis quicker than you can Google “How to create a Process Capability Chart in Excel” Sample Mean: ? Sample Standard Deviation: ? Or Upload Historical…
Improve your Lean Six Sigma projects with our free templates. They're designed to make implementation and management easier, helping you achieve better results.