What is Process Capability

Guide: Process Capability Analysis (Cp, Cpk)

Author's Avatar

Daniel Croft

Daniel Croft is an experienced continuous improvement manager with a Lean Six Sigma Black Belt and a Bachelor's degree in Business Management. With more than ten years of experience applying his skills across various industries, Daniel specializes in optimizing processes and improving efficiency. His approach combines practical experience with a deep understanding of business fundamentals to drive meaningful change.


Process Capability Analysis stands is a core of Lean Six Sigma and Quality Control and Management technique, used as an important tool in manufacturing and production. This analytical approach determines how effectively a process consistently yields outputs within customer-specified limits, ensuring adherence to quality standards and expectations. The essence of this method lies in its ability to identify and mitigate defects, thereby guaranteeing product reliability and customer satisfaction.

In this guide, we delve into the intricacies of Process Capability Analysis, employing a practical example from the food manufacturing sector, specifically focusing on packaged cookies. We will explore how this analysis, through the computation of Cp and Cpk values, provides a deeper understanding of a process’s capability, both in terms of meeting specifications and maintaining target alignment.

Table of Contents

What is Process Capability Analysis?

Process Capability Analysis is a key method used in Lean Six Sigma and Quality Control and Management. It is primarily used in manufacturing and production processes to evaluate how well a process can consistently produce outputs within specifications (usually set by the customer). This analysis is important to measure that products meet the quality standards and customer expectations that have been set and ensure processes are not producing defects.

Example use case

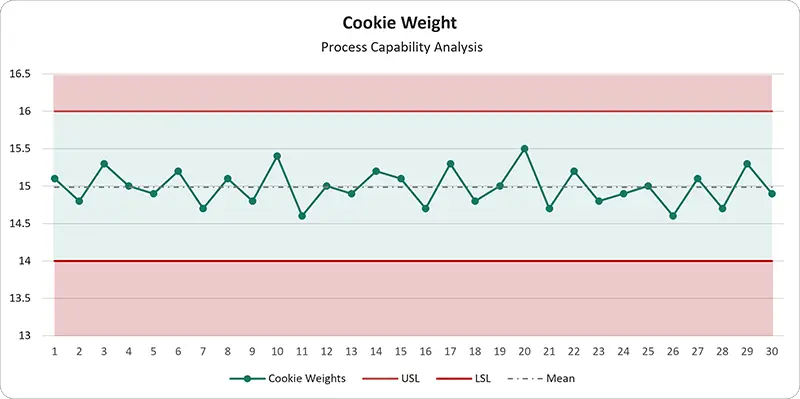
To help you get a basic understanding of Process capability analysis and build up your knowledge through this guide. Let’s consider a food manufacturing example where we have applied Process Capability Analysis. This company manufactures packaged cookies, and a key quality attribute is the weight of each cookie. The specified weight range for a cookie is between 14 grams Lower Specification Limit, (LSL) and 16 grams Upper Specification Limit (USL). The target weight is 15 grams.

Cookie Weights Process Capability Analysis Graph

In simple terms we can see the sample data shows us all the data points are within the USL and LSL, therefore we can understand that the process is capable. However, Process Capability Analysis goes into more detail this to provide a metric of how capable a process is with Cp and Cpk values which we will explain in much more detail within this guide.

What is Cp and Cpk?

Understanding Cp and Cpk in the context of Process Capability Analysis is necessary for assessing the capability of manufacturing and production processes. These indices provide insights into how well a process can produce outputs that meet predefined specifications.

What is the Process Capability Index (Cp)?

Cp, or the Process Capability Index, is a fundamental measure in process capability analysis. It evaluates a process’s ability to produce outputs within the specified limits under the assumption that the process is statistically stable, or in control.

Cp is used to assess the potential of a process to meet specification limits without considering the actual position of the mean of the process.

For this illustrative purposes let’s consider the width of a car is the amount of variation in the process, and the garage walls are the process limits UCL and LCL. If the car can fit into the garage without hitting the wall, we would say it is capable and would have a Cp score of at least 1. If the width of the car is greater than the width of the garage we would say the car is not capable and would have a Cp score of less than 1.
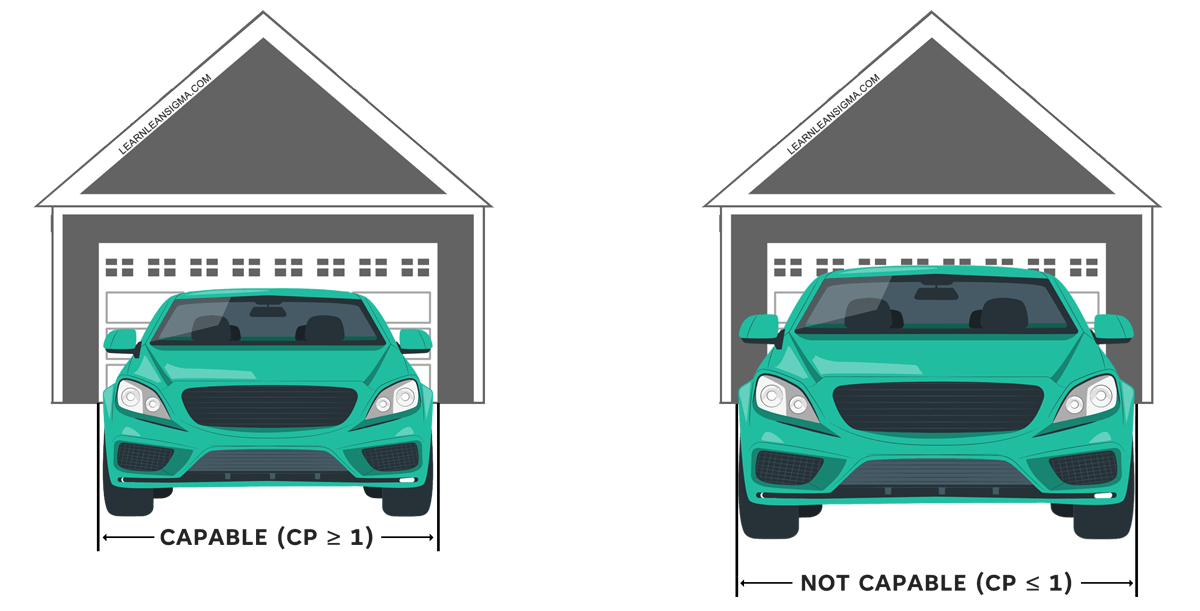
CPK Process Capability - Car Example Cp above and below 1

For this, if the car hits or scapes the sides of the garage entrance we would class that as a defect. But when the car is capable of fitting into the garage as it is narrower than the width of the entrance AND the car is centred the car will fit and therefore not be a defect.

However, with Cp alone we do NOT consider if the car was in the center as it goes into the garage therefore the process would not be capable with a Cp of 1 and an off-center process. Cpk is a measure of process capability as well as how well-centred the process is. We will cover the Cpk measurement in more detail below.

First you need to understand the calculation of Cp then you will be able to understand the Cpk calculation and understand if your process is capable and centered in the process.

What is the Process Capability Index (Cp) Calculation?
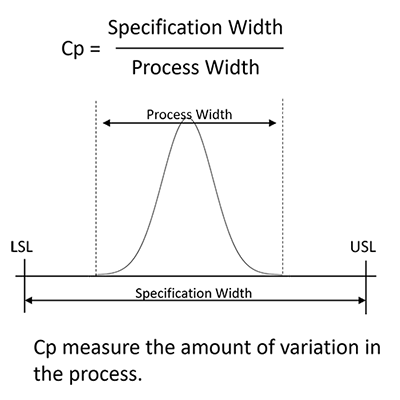
Explaination of Cp CalculationIn this formula:

  • USL (Upper Specification Limit): The maximum acceptable value for the process output.
  • LSL (Lower Specification Limit): The minimum acceptable
    value for the process output.
  • σ (Standard Deviation): A measure of the process’s variability.

If you are not sure how to calculate standard deviation you can look at our guide on Standard deviation or use our standard deviation calculator to help with this step.

Cp Process Capability formula

Example Calculation Process Capability (Cp) Calculation

Continuing with the cookie example to calculate Cp of cookie weights let’s revisit the scenario and the data. Remember, our focus is on the weight of the cookies, with the Upper Specification Limit (USL) set at 16 grams and the Lower Specification Limit (LSL) at 14 grams.

  • USL (Upper Specification Limit): 16 grams
  • LSL (Lower Specification Limit): 14 grams
  • Standard Deviation (σ): 0.24 grams

So using the formula from above we need to do the following:

  1. USL – LSL: 16-14 = 2
  2.  Standard Deviation X 6:  0.24 x 6 = 1.44
  3. 2 Divided by 1.44 = 1.39
  4. Cp = 1.39

The Cp of 1.39 suggests that the process is capable of producing cookies within the specification limits (USL and LSL). However, this is only true if we know the process is centred within the limits, and the amount of variation suggested is capable but if the mean cookie weight is 15.5 some of the cookies could be over the specification weight and therefore classed as defects. So to understand how well centered the process is we need to understand and calculate the Cpk, which is the next step.

What is the Process Capability Index (Cpk)?

Cpk, or the Corrected Process Capability Index, improves the Cp measure by incorporating the mean’s position relative to the specification limits. This index is crucial for understanding both the variability and the centrality of the process.

Cpk is used to assess a process’s capability to produce outputs within specification limits while considering the actual position of the process mean. It’s a more realistic measure of a process’s capability.

Consider the following scenario: We calculated a process capability index (Cp) of 1.5, indicating that the process can comfortably produce within the specified limits, much like cars being able to fit in a garage. However, even with a Cp of 1.5, not all cars are centered in the garage; similarly, our process might not be centered between the upper and lower specification limits (USL and LSL).

CPK Process Capability Car Example Cp 1.5 but off center

It’s important to note that a process can have a Cp of 1 or higher and still not be perfectly centered within the specification limits. To address this, we should calculate the process capability index (Cpk), which considers both the spread and the centering of the process relative to the target. This helps us understand if the process is truly capable when factoring in the desired target.

What is the Process Capability Index (Cpk) Calculation?

In the Cpk formula, we consider the same elements as in Cp (USL, LSL, and standard deviation), but we also include the process mean ():

  • USL (Upper Specification Limit): The maximum acceptable value for the process output.
  • LSL (Lower Specification Limit): The minimum acceptable value for the process output.
  • σ (Standard Deviation): A measure of the process’s variability.
  • ˉ (Process Mean): The average value of the process output.

Explaination of Cpk Calculation

To calculate the Cpk we need to calculate the distance of process edge to upper spec limit (Cpu) and the distance of the process edge to the lower spec limit (Cpl) and then take the lowest value of those two results.

Cpk Process Capability formula

Example Calculation: Process Capability (Cpk) Calculation

Let’s continue with the cookie example for calculating Cpk of cookie weights. We already know the USL, LSL, and standard deviation. Now, suppose the average weight of the cookies () is 15.2 grams. Using the formula, we need to calculate:

  1. Cpk Lower calculation (Step1 – Calculate top and bottom) = (15.2 – 14) / (3 x 0.24)
  2. Cpk Lower Calculation (step 2 – Divide top by bottom) =1.2 / 0.72 = 1.67

Cpk (Lower) = 1.67

  1. Cpk Upper calculations (step 1 – calculate top and bottom) = (16 – 15.2) / (3 x 0.24)
  2. ​Cpk Upper Calculation (Step 2 – Divide top by bottom) = 0.8 / 0.72 = 1.11

Cpk (Upper) = 1.11

So, the Cpk for this process is the lower of the two values, which is 1.11. This value indicates that while the process is capable, the centering of the cookie weights is not optimal, as reflected by the Cpk being lower than the Cp. It suggests that there is room for improvement in centering the process closer to the target mean.

Types of process Capability issues

Understanding the various types of process capability issues is essential for effective quality control and process improvement in manufacturing and production. Each type presents unique challenges and requires specific strategies for improvement. The process capability can be broadly categorized based on two criteria: whether the process is on target and whether it is capable. Here’s a detailed look at each type:

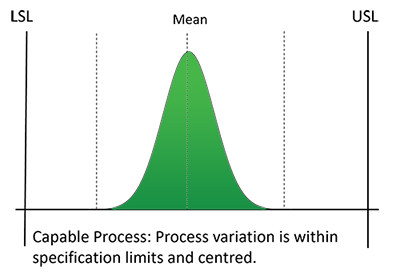
Process on Target and Capable

This is the ideal scenario. The process is both capable of producing within specification limits (high Cp and Cpk values) and centered around the target.

Process On Target and Capable

Characteristics: Consistently produces quality products with minimal variation and defects.

Example: A machine that consistently produces parts with dimensions very close to the target value and well within the upper and lower specification limits.

Improvement Focus: Maintain process stability and monitor for any shifts or drifts.


Process off Target and Capable

The process is capable (high Cp) of producing within the specification limits, but it is not centered around the target (lower Cpk).Process Off Target and Capable2

Characteristics: While the output mostly meets the specifications, the mean of the process is shifted away from the target, leading to a higher risk of defects.

Example: A filling machine that fills bottles to an average volume slightly above or below the target volume, but has an acceptable level of variation.

Improvement Focus: Adjust and recalibrate the process to center it around the target.


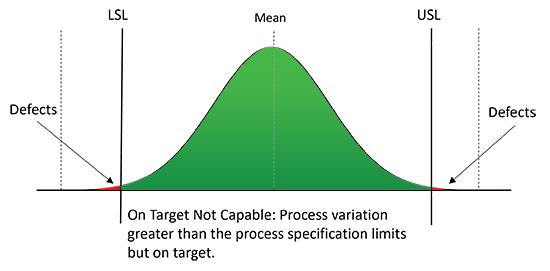
Process on Target and not capable

The process mean is on target, but the variation is too high (low Cp), leading to outputs frequently falling outside the specification limits.

Process On Target and Not Capable

Characteristics: Even though the average output is at the desired level, the inconsistency in production leads to a significant proportion of defects.

Example: An oven that bakes cookies to the correct average weight, but with substantial variation in individual cookie weights.

Improvement Focus: Identify and eliminate sources of variation to make the process more consistent.

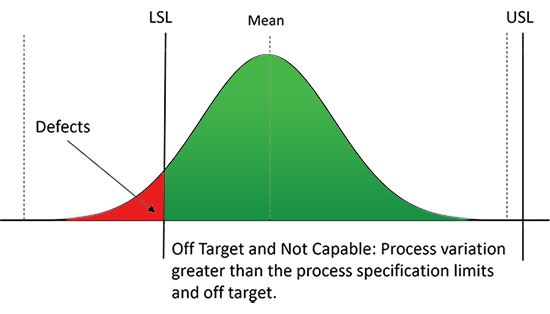
Process off Target and not capable

The worst-case scenario where the process is neither capable nor centered. It has both high variation and a mean that is away from the target.

Process Off Target and Not Capable

Characteristics: Produces a high level of defective outputs and is inefficient.

Example: A cutting machine that consistently cuts materials to lengths that are both variable and generally too short or too long.

Improvement Focus: Comprehensive process analysis and overhaul are required. Focus on both reducing variation and aligning the process with the target.

What is Pp and Ppk?

What is the Process Performance Index (Pp)?


What is the Process Performance Index (Pp) Calculation?


What is the Process Performance Index (Ppk)?


What is the Process Capability Index (Cpk) Calculation?

What are the Differences Between Cp/Cpk and Pp/Ppk?

How is Process Capability Analysis used in Quality Control?

How to do a Process Capability Analysis?

Step 1: Define the Process and Specifications


Step 2: Collect Data


Step 3: Test for Statistical Control


Step 4: Calculate Process Capability Indices


Step 5: Analyze the Results


Step 6: Implement Improvements


Step 7: Establish Ongoing Monitoring

Conclusion

Process Capability Analysis is a key tool in quality control and process optimization. By breaking down and examining the concepts of Cp and Cpk, we gain valuable insights into a process’s ability to produce within specifications and its alignment with target objectives.

The cookie manufacturing example illustrates these concepts in action, demonstrating how understanding and applying Cp and Cpk can lead to significant quality improvements. Furthermore, recognizing the different types of process capability issues – whether a process is on target, capable, or neither – empowers us to implement targeted improvements. This guide, therefore, serves not just as an introduction but as a practical tool for those seeking to enhance their process quality, align outputs with customer expectations, and drive efficiency in their manufacturing and production processes.

References

  •  

A: Process Capability (CP) is a statistical measure that quantifies how well a process can produce output within specified limits. It compares the width of the process spread or variability to the width of the specification limits. A higher CP value indicates a more capable process with less variability relative to the specified limits.

A: CP is calculated using the formula: CP = (USL – LSL) / (6 * σ), where USL is the upper specification limit, LSL is the lower specification limit, and σ is the standard deviation of the process. This formula assumes that the process is centered between the specification limits and that the process distribution is normal.

A: Process Capability Index (CPK) is a statistical measure that quantifies how well a process can produce output within specified limits, taking into account whether the process mean is centered within the limits. Unlike CP, which assumes the process is perfectly centered, CPK provides a more accurate measure of a process’s capability to produce within specifications when the process mean shifts away from the center.

A: CPK is calculated using the formula: CPK = min[(USL – μ) / (3σ), (μ – LSL) / (3σ)], where μ is the process mean, and σ is the standard deviation of the process. This calculation considers the worst-case scenario of the process’s ability to meet the specification limits, accounting for any shift in the process mean.

A: CP and CPK values provide insights into the process’s ability to produce output within specified limits. A CP value greater than 1 indicates that the process has the potential to meet specification limits if it is perfectly centered. A CPK value greater than 1 suggests that the process is meeting specification limits in its current state, including any shift in the process mean. In general, higher values of CP and CPK indicate a more capable and consistent process.

Author

Daniel Croft

Daniel Croft

Daniel Croft is a seasoned continuous improvement manager with a Black Belt in Lean Six Sigma. With over 10 years of real-world application experience across diverse sectors, Daniel has a passion for optimizing processes and fostering a culture of efficiency. He's not just a practitioner but also an avid learner, constantly seeking to expand his knowledge. Outside of his professional life, Daniel has a keen Investing, statistics and knowledge-sharing, which led him to create the website learnleansigma.com, a platform dedicated to Lean Six Sigma and process improvement insights.

All Posts

Helpful Tools

Free Lean Six Sigma Templates

Improve your Lean Six Sigma projects with our free templates. They're designed to make implementation and management easier, helping you achieve better results.

Other Guides