Guide: Waste Analysis
-
Daniel Croft

Waste Analysis in Lean Six Sigma you may be surprised to discover that most activities in business are non-value-adding, taking up resources without giving customers what they pay for. Picture a pie chart where the majority slice is what we don’t want; that’s the waste we’re tackling. This guide zooms in on ‘Muda,’ one of the waste types in Lean Six Sigma, including eight wastes known by the acronym TIMWOODS or DOWNTIME. We’ll help you spot these using tools like process maps and more, so let’s cut down that waste slice together.
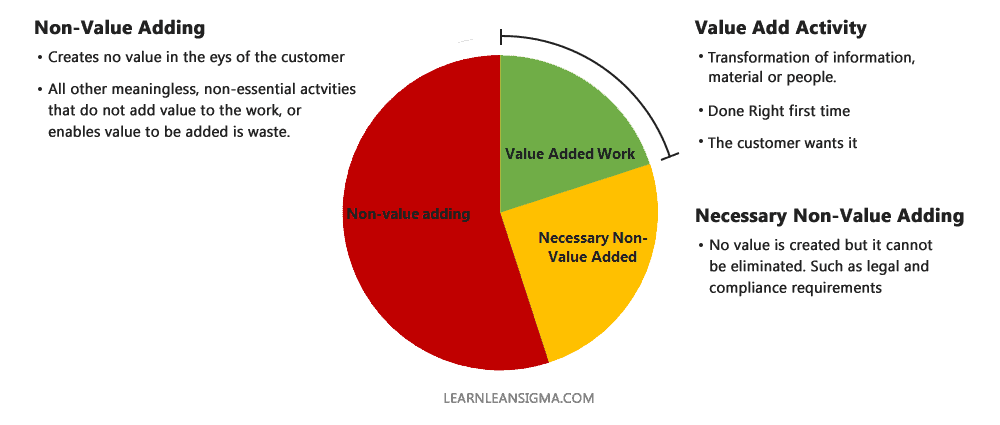
Within the concept of Lean Six Sigma, every activity can be categorized as one of the three following types: value-adding (VA), non-value-adding (NVA), or necessary non-value-adding (NNVA). Anything that is non-value-adding is defined as an activity that uses resources but creates no value for the customer.
You may be surprised to find that most businesses have activities that are over 70% non-value-adding, and if you visualise this with a pie chart, it would look similar to the one below.

Value Add analysis Pie chart
If the activity that transforms information, material, or people is done right the first time and the customer is willing to pay for it then it is value-added; otherwise, it is non-value-added. Within Lean Six Sigma, waste can also come in three different categories: Muda, Mura, and Muri. Review that guide to explore these waste categories in more detail.
Within this waste analysis guide, we will focus on the Muda waste, which is NVA waste but can also include NNVA waste. These wastes can come in many forms and are commonly known as the 7 waste or 7 Mudas, but recently a new waste was added, making it the 8 wastes of lean.
Join our email list below and for the next 28 days, we will send you exclusive tools, templates and guides unavailable on the website. We developed a short and simple 28-day program designed to develop your ability to implement Lean and Six Sigma methods daily.
Within Lean Six Sigma, there are eight commonly known types of Muda waste: Transportation, Inventory, Motion, Waiting, Over-production, Over-process, Defects, and Skills commonly referred to by the acronym TIM WOODs or the if order is rearranged DOWNTIME.
Below is a brief overview of each of the waste types. However, if you want the full guide, look at our 8 Wastes Guide.
Transport: This type of waste occurs when materials, products, or information are moved more than necessary.
Inventory: Excessive inventory, whether in raw materials, work-in-progress, or finished goods, ties up capital, takes up space, and can lead to obsolescence or spoilage.
Motion: Similar to transport, but specific to people, this waste occurs when employees have to make unnecessary movements to complete their tasks.
Waiting: Anytime work is stalled or employees are idle because they are waiting for materials, information, equipment, or authorization, this is considered waste.
Overproduction: Producing more than what is immediately needed leads to excess inventory. Overproduction is often the result of poor planning, large batch sizes, or misaligned incentives.
Over-processing: Adding more features, processes, or elements to a product or service than what is valued by the customer is over-processing.
Defects: When products or services don’t meet quality standards and require rework or scrap, this is a defect.
To reduce the amount of NVA and NNVA activity in your processes, you first need to identify the waste in your process.
There are a range of Lean Six Sigma methods that can be used to identify waste within a business, such as value stream mapping, Gemba walks, and spaghetti diagrams.
Process Mapping:
Process mapping is a workflow diagram to bring forth a clearer understanding of a process or series of parallel processes. It illustrates the inputs, actions, and outputs of a process in a clear, step-by-step map of the process. This is very helpful in identifying where waste occurs in the process.

Detailed sub process map
Read the full guide on Process Mapping to understand this tool in more detail.
Value Stream Mapping (VSM):
Value Stream Mapping is a visual tool used to illustrate, analyze, and improve the flow of materials and information required to bring a product or service to a consumer. A VSM helps identify bottlenecks, redundancies, and delays in the process. It captures both the material (product) and the information flow.

Value Stream Map (VSM)
Read the full guide on Value Steam Mapping to understand this tool in more detail.
Gemba Walks:
The term “Gemba” means “the real place” in Japanese. In Lean Six Sigma, a Gemba Walk involves going to the place where the work is done. It is an observational walk to see where value is created and to observe the realities of a process, rather than what might be assumed or reported. During the walk, managers and leaders observe, listen, and understand the work process, ask questions, and learn about the work being done.
Read the full guide on Gemba Walks to understand this method in more detail.
Spaghetti Diagrams:
A Spaghetti Diagram is a visual representation showing the physical flow or movement of people and materials within a process. It’s called a “Spaghetti” diagram because the lines crisscrossing back and forth over a layout can resemble a bowl of spaghetti. This tool helps identify unnecessary movements that can cause delays, excess effort, and inefficiency.
Data Collection:
Data collection involves using check sheets, time studies, and various data-gathering techniques to capture information about the frequency and causes of potential waste in a process. It quantifies the waste and provides a baseline for improvement measures.
The output of the analysis can then be visualised to see how much of the process steps are non-value-add such as in the below image.

Value add analysis example
Once you have collected data to measure waste in your processes the next thing to do is to analyze the waste in the process to understand how the process can be improved by using methods such as Root Cause Analysis and Pareto principle analysis.
Root Cause Analysis (RCA):
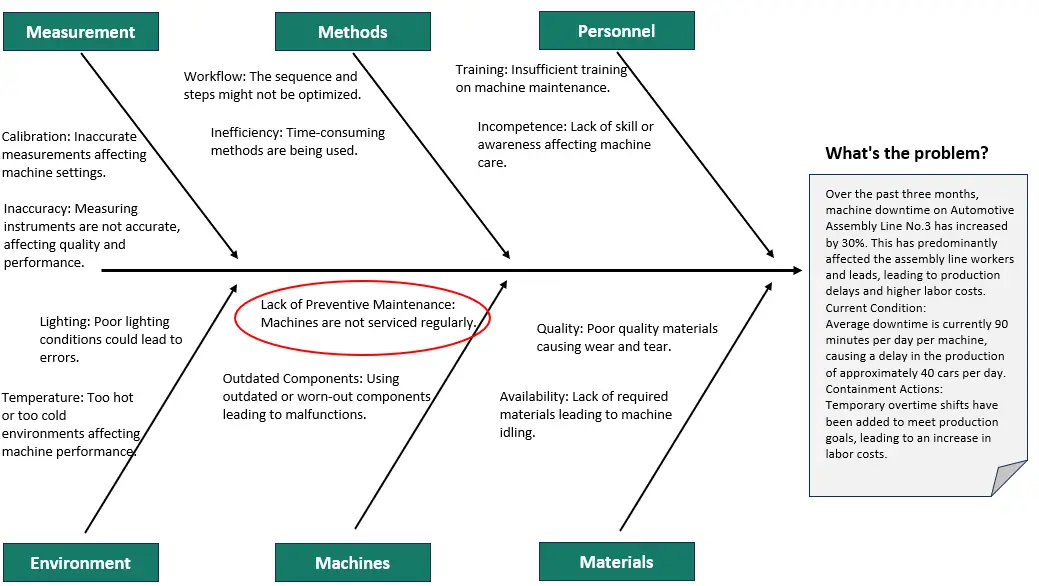
This is a systematic process for identifying the root causes of problems or events and an approach for responding to them. RCA is based on the basic idea that effective management requires more than merely “putting out fires” for problems that develop, but finding a way to prevent them. Tools such as the 5 Whys and Fishbone (Ishikawa) Diagram are commonly used for RCA.

Read the full guide on Root Cause Analysis to understand this method in more detail.
Pareto Analysis:
A Pareto Analysis, or Pareto Chart, is a statistical technique in decision-making used for the selection of a limited number of tasks that produce significant overall effect. It uses the Pareto Principle (also known as the 80/20 rule) where roughly 80% of the problems are produced by 20% of the causes.

Read the full guide on Pareto Analysis to understand this method in more detail.
Now that you understand the waste you have and have analyzed the waste, the next step is to improve the process by either eliminating the waste or reducing the amount of resources it takes in the process.
There are three main Lean Six Sigma methods that can support this:
Kaizen: Kaizen is a Japanese word that means “continuous improvement”. It’s a strategy where employees at all levels of a company work together proactively to achieve regular, incremental improvements to the manufacturing process.
Standard Work: Standard Work is the practice of setting, communicating, following, and improving standards. Establishing standard Work for a process ensures that it is done with the least waste of time and resources and in the same way every time, which is a foundation for continuous improvement.
5S: The 5S methodology is a system for organizing spaces so work can be performed efficiently, effectively, and safely. This system focuses on putting everything where it belongs and keeping the workplace clean, which makes it easier for people to do their jobs without wasting time or risking injury.

After following one of these methods to make process improvements the final step is to sustain these improvements to ensure that the process does not return back to how it was before with waste returning to the process.
This can be done with a range of control tools such as Control Charts and Visual Management.
Control Charts:
Control charts are a statistical tool used to distinguish between variation in a process resulting from common causes and variation resulting from special causes. It is a tool to monitor, control, and improve process performance over time by studying variation and its source.

Visual Management:
This is a system of managing a workplace or area using visual signals instead of written instructions. The goal is to improve communication and efficiency by using visual information to regulate production.
You’ve walked through identifying, measuring, analyzing, and eliminating waste with us. From process maps to Pareto charts, we’ve shared simple yet effective tools to spot and shrink the non-value-adding activities in your business. Remember, it’s not a one-off cleanup but a cycle of continuous improvement. Use control charts and visual management to keep your processes lean and mean. Don’t let waste creep back in; stay vigilant and sustain those gains. For more in-depth insights, check our full guides and keep trimming that waste pie to size.
A: Waste analysis is a systematic evaluation process used in the Lean methodology to identify activities that do not add value to a product or service. The primary goal is to pinpoint and eliminate these non-value-adding activities, leading to improved efficiency, reduced costs, and enhanced customer value.
A: “TIMWOODS” is an acronym representing the eight primary wastes in Lean: Transportation, Inventory, Motion, Waiting, Overproduction, Overprocessing, Defects, and Skills. Each type of waste represents a specific kind of inefficiency in a process, and by categorizing them, it becomes easier to identify, understand, and address each one systematically.
A: A Gemba Walk, derived from the Japanese term “Gemba” meaning “the real place,” involves going to the actual location where work is performed to observe processes firsthand. It’s a fundamental aspect of waste analysis, allowing teams to see real-world operations, identify inefficiencies, and understand the context in which wastes occur.
A: No. While Lean and waste analysis originated in manufacturing (notably with Toyota), the principles are universally applicable. Organizations across various sectors, including services, healthcare, IT, and finance, have successfully adopted waste analysis to enhance their operations.
A: Not necessarily. Lean emphasizes continuous improvement. Even after initial wastes are addressed, it’s beneficial to regularly revisit processes, identify new inefficiencies, and refine strategies. The aim is to foster an organizational culture where improvement is an ongoing journey, not a one-time initiative.

Hi im Daniel continuous improvement manager with a Black Belt in Lean Six Sigma and over 10 years of real-world experience across a range sectors, I have a passion for optimizing processes and creating a culture of efficiency. I wanted to create Learn Lean Siigma to be a platform dedicated to Lean Six Sigma and process improvement insights and provide all the guides, tools, techniques and templates I looked for in one place as someone new to the world of Lean Six Sigma and Continuous improvement.