What is a Process Map

Guide: Process Mapping

Author's Avatar

Daniel Croft

Daniel Croft is an experienced continuous improvement manager with a Lean Six Sigma Black Belt and a Bachelor's degree in Business Management. With more than ten years of experience applying his skills across various industries, Daniel specializes in optimizing processes and improving efficiency. His approach combines practical experience with a deep understanding of business fundamentals to drive meaningful change.

Process Mapping, a key lean tool in continuous improvement. Regardless of the industry you’re in having a clear understanding of your processes is important for efficiency and effectiveness. Process Mapping is a visualization of your operations, allowing you to see how tasks flow, who is responsible for what, and where bottlenecks or inefficiencies may exist.

Through simple symbols and lines, this tool highlights the sequence of actions from start to finish, making it easier for teams to communicate and collaborate.

Table of Contents

What is Process Mapping?

A Visual Guide to Your Operations

At its core, Process Mapping is like a visual guide for your business processes. It visually represents each step, action, or operation involved in a process from start to finish. Utilizing various symbols, shapes, and arrows, it paints a clear picture of how tasks flow through the system. This visualization makes it easier to understand complex workflows, especially for those who are not directly involved in the process.

Basic flow chart or Process map

Detailed sub process map

Key Elements of Process Mapping

  • Activities: These are the tasks or operations that are part of the process. An activity could be as simple as ‘Approve Request’ or as complex as ‘Conduct Quality Assurance Testing’.

Activity Shape

  • Inputs/Outputs: Every activity in a process typically has something that triggers it (input) and produces a result (output). For instance, an input could be a customer order, and the output could be the shipped product.

  • Decision Points: These are the junctures where a decision needs to be made, often represented by diamond shapes in the map. For example, a decision point might be “Is the inventory sufficient?”

Decision Shape

  • Roles: This specifies who is responsible for each activity. Assigning roles removes ambiguity and ensures accountability.

Why is Process Mapping Important?

More than Just a Diagram

While it may seem like an exercise in drawing, Process Mapping has profound implications for your operations. Here’s why:

  • Identifies Bottlenecks: A well-designed process map can immediately show you where your process slows down. Maybe there’s a step that takes disproportionately long or a decision point where things often get stuck. Identifying these bottlenecks is the first step in solving them.
  • Improves Communication: A process map serves as a single point of truth. It provides a universal language that helps in reducing misunderstandings and streamlining communications among team members.

  • Enhances Efficiency: By visualizing the entire process, you can easily spot redundancies or unnecessary steps that can be removed or simplified, making the whole system more efficient.

  • Facilitates Training: For new hires or team members unfamiliar with the process, a process map can serve as an excellent training tool. It provides an at-a-glance understanding that might otherwise take weeks to grasp.

By integrating Process Mapping into your continuous improvement strategies, you’re well on your way to a more efficient, communicative, and streamlined operation.

Types of Process Maps

Process Mapping isn’t a one-size-fits-all approach. There are various types of maps that serve different needs, depending on the complexity of the process, the level of detail required, and the audience for the map. Here’s a deep dive into four common types:

1. Flowcharts

What are they?

Flowcharts are the most basic form of process maps. They are excellent for mapping out simple processes or tasks that don’t require much detail. They typically use basic shapes like ovals for start/end, rectangles for processes, and diamonds for decision points.

When to Use
  • When the process is straightforward and involves few steps.
  • When a quick, easy-to-understand representation is sufficient.
Basic flow chart or Process map

Detailed sub process map

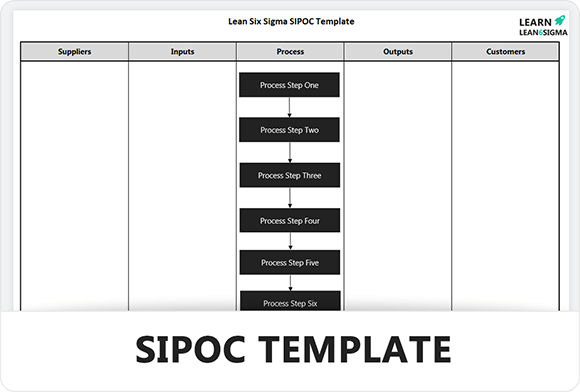
2. SIPOC Maps (Suppliers, Inputs, Process, Outputs, Customers)

What are they?

SIPOC Maps take a high-level view of a process and focus on identifying the Suppliers, Inputs, Processes, Outputs, and Customers. This type of map is particularly useful for understanding the broader ecosystem of a process.

When to Use
  • When you need to understand how a process interacts with external factors.
  • During the initial stages of process improvement for scope definition.

Example of complete SIPOC

3. Value Stream Maps

What are they?

Value Stream Maps are commonly used in Lean methodologies. They not only map the process but also add data about time, cost, and resources to help identify value-added and non-value-added activities.

When to Use
  • When you’re applying Lean methodologies.
  • When you want to understand and reduce waste in the process.
Value Stream Map (VSM)

Value Stream Map (VSM)

4. Cross-Functional Flowcharts (Swimlane Diagrams)

What are they?

Cross-Functional Flowcharts, also known as Swimlane Diagrams, show how a process moves between different teams or departments. Each ‘lane’ in the chart represents a different department or role.

When to Use
  • When the process involves multiple departments or teams.
  • When you need to clarify roles and responsibilities across departments.
Business Process Mapping Swim lane cross functional process map

Swimlane / Cross functional process map

Steps to Create a Process Map

Creating a process map may seem like a daunting task, but breaking it down into structured steps can make it manageable and effective. Below is an in-depth guide on how to go about each stage of creating a process map.

1. Define Objectives

Before you even pick up a pen, you need to know what you aim to achieve with the process map. Are you trying to streamline operations, train new employees, or identify bottlenecks? Your objectives will guide the type of process map you choose and the level of detail it will require.

Key Points to Consider

  • What problem are you trying to solve?
  • Who is the target audience for the map?

2. Identify Stakeholders

Identifying stakeholders means listing all the parties who are involved in the process or will be affected by changes to it. This can include team members, managers, suppliers, and even customers.

Key Points to Consider

  • Who performs tasks in this process?
  • Who oversees or manages this process?
  • Who are the end-users or beneficiaries?

3. Gather Data

You need concrete information to build your map. This involves gathering data on activities, roles, and the sequence of steps. You may use interviews, observations, or review existing documentation to collect this data.

Key Points to Consider

  • What are the specific tasks or activities?
  • What inputs and outputs are associated with each activity?
  • Are there decision points? If so, what are the criteria?

4. Draft the Map

With all the preliminary work done, it’s time to put pen to paper—or cursor to screen. You can use specialized software or simply draw it out manually. Place the activities, decision points, and roles in their respective places and connect them with arrows to indicate flow.

Key Points to Consider

  • Use standard symbols for ease of understanding.
  • Make sure the flow is logical and clear.

5. Review

Once the initial draft is ready, share it with the identified stakeholders for review. They can provide insights you might have missed, suggest changes, or confirm that the map is accurate.

Key Points to Consider

  • Is the map easy to understand?
  • Does it accurately represent the process?

6. Iterate

Based on the feedback, make revisions as necessary. This might involve adding missing steps, clarifying roles, or even redefining the objectives if new insights have come to light.

Key Points to Consider

  • Are all stakeholder concerns addressed?
  • Does the map align with the original objectives?

7. Finalize and Implement

Once the map has been reviewed and revised, it’s time to finalize it. The finished process map can then be used for training, documentation, and as a basis for continuous improvement efforts.

Key Points to Consider

  • Make the final version accessible to all relevant parties.
  • Use it as a tool for training and operational excellence.

Conclusion

In summary, Process Mapping serves as a navigational tool for your business operations, offering a visual guide to understand, analyze, and improve complex processes. By breaking down the steps, identifying roles, and spotlighting decision points, this technique elevates your continuous improvement initiatives from a guessing game to a data-driven strategy.

Whether you opt for a basic Flowchart for simpler tasks or a more intricate Value Stream Map to scrutinize every detail, the importance of selecting the right type of process map cannot be overstated. The structured approach to creating a process map, which includes defining objectives, involving stakeholders, and iterative refinement, ensures that the final product is both accurate and actionable. As you embark on your journey toward operational excellence, keep this guide handy as a comprehensive resource for unlocking the immense potential of Process Mapping.

References

A: There are numerous software tools available for Process Mapping, ranging from specialized software like Visio and Lucidchart to general-purpose tools like PowerPoint and Google Slides. Your choice of tool may depend on the complexity of the process and the features you require, such as collaboration or data integration.

A: The frequency of updates to your Process Map depends on how often the process itself changes. For dynamic processes that are subject to frequent alterations, quarterly reviews may be beneficial. For more stable processes, an annual review could suffice. Always update the map after any significant change to the process.

A: While expertise in the process can be beneficial, it’s not strictly necessary. The key is to involve stakeholders who are experts or directly involved in the process. Their input can provide the detailed information needed to create an accurate map.

A: Disagreements among stakeholders can occur, especially for complex processes. In such cases, it may be helpful to return to the data gathering stage to collect more information, or even observe the process in action to resolve discrepancies. Consensus is crucial for the map to be effective.

A: The level of detail in your Process Map should align with its objectives. For a high-level overview, a less detailed map may suffice. However, if the goal is to identify bottlenecks or areas for improvement, a more detailed map that includes time, cost, and resource information could be more beneficial.

Author

Daniel Croft

Daniel Croft

Daniel Croft is a seasoned continuous improvement manager with a Black Belt in Lean Six Sigma. With over 10 years of real-world application experience across diverse sectors, Daniel has a passion for optimizing processes and fostering a culture of efficiency. He's not just a practitioner but also an avid learner, constantly seeking to expand his knowledge. Outside of his professional life, Daniel has a keen Investing, statistics and knowledge-sharing, which led him to create the website learnleansigma.com, a platform dedicated to Lean Six Sigma and process improvement insights.

All Posts

Download Template

Free Lean Six Sigma Templates

Improve your Lean Six Sigma projects with our free templates. They're designed to make implementation and management easier, helping you achieve better results.

Other Guides