Guide

Guide: Impact and Effort Matrix

Updated Jan 30, 2026
18 Min Read
A practical guide to using the Impact and Effort Matrix to prioritise ideas, focus on quick wins, and avoid wasting time on improvements that deliver little real value.
What is Impact and Effort Matrix
Last Updated Jan 30, 2026

Everything feels urgent, but not everything is important. It is the classic dilemma of modern work: we spend 40 hours a week “busy,” yet when Friday arrives, we wonder what we actually accomplished. The problem isn’t our work ethic; it’s our definition of work.

Traditional to-do lists are linear. Item #1 looks just as important as Item #10. The Impact vs. Effort Matrix (also known as the Action Priority Matrix) breaks this linearity. It is a decision-making tool that helps individuals and teams navigate chaos by adding a second dimension to their planning. By plotting tasks based on the value they deliver versus the resources they consume, you can instantly categorize your to-do list into an actionable roadmap. This complements other frameworks like SWOT Analysis and OKRs, providing a granular way to execute on your broader strategy.

Quick Wins
(High Impact, Low Effort)
Major Projects
(High Impact, High Effort)
Fill-Ins
(Low Impact, Low Effort)
Thankless Tasks
(Low Impact, High Effort)
IMPACT
EFFORT
ROI Factors:
  • Revenue
  • Customer Value
  • Strategic Fit
Cost Factors:
  • Time
  • Complexity
  • Risk
FREE

Join the 28-Day Lean Challenge

Take your skills to the next level. Join 15,000+ practitioners and get exclusive tools delivered to your inbox.

Daily Lessons 5 Bonus Templates PDF Guides
Start the Challenge

No spam. Unsubscribe anytime.

The Anatomy of the Matrix


Before plotting tasks, we must define our axes. Subjectivity is the enemy of prioritization, so it is crucial to agree on what constitutes “High” vs “Low.” According to Harvard Business Review, decision-making improves significantly when criteria are explicit rather than implicit.

Effort (X-Axis) represents the cost of doing business. It isn’t just about time; it includes:

  • Time: Hours, days, or weeks required.
  • Complexity: Does it require specialized skills or cross-team coordination?
  • Risk: Is there a chance it will break something else?

Impact (Y-Axis) represents the return on investment. This is often harder to quantify, but usually involves:

  • Revenue: Will this directly make money?
  • Customer Value: Does it solve a burning complaint?
  • Strategic Fit: Does it move us closer to our annual goals?
Quick Wins
(High Impact, Low Effort)
Major Projects
(High Impact, High Effort)
Fill-Ins
(Low Impact, Low Effort)
Thankless Tasks
(Low Impact, High Effort)
IMPACT
EFFORT
ROI Factors:
  • Revenue
  • Customer Value
  • Strategic Fit
Cost Factors:
  • Time
  • Complexity
  • Risk
Use the interactive calculator below to visualize the trade-off between resource cost (Effort) and potential value (Impact). Adjust the sliders to see how the category changes.
50%
50%
Category
Adjust Sliders
See result here
Interactive Figure 1.1: Prioritization Calculator

The Four Quadrants

Once you understand the axes, the matrix divides your world into four distinct zones. Each zone requires a specific psychological approach.

  • Quick Wins (High Impact, Low Effort): These build momentum and trust with stakeholders. If you are new to a team, start here to prove value quickly.
  • Major Projects (High Impact, High Effort): These are your “big bets.” They require project management, milestones, and dedicated resources. The danger here is “Scope Creep.”
  • Fill-Ins (Low Impact, Low Effort): These are dangerous distractions. They feel productive because they are easy to check off (e.g., “Inbox Zero”), but they don’t move the needle. Save these for Friday afternoons when your brain is tired.
  • Thankless Tasks (Low Impact, High Effort): Also known as “Money Pits.” These often exist because of the “Sunk Cost Fallacy”—we keep doing them because we’ve always done them. Be ruthless in eliminating these.
Explore the interactive grid below. Hover over each quadrant to reveal specific strategies for handling tasks in that zone.
Q1

Quick Wins

Your highest priority.
Strategy: Do it now.
Q2

Major Projects

Strategic goals.
Strategy: Schedule it.
Q3

Fill-Ins

Low impact tasks.
Strategy: Delegate.
Q4

Thankless Tasks

Resource drains.
Strategy: Eliminate.

Put It Into Practice

Theory is easy, but practice is hard. In the heat of the moment, we often confuse “hard work” with “valuable work.” This is often due to Complexity Bias, our tendency to prefer complicated solutions over simple ones. Test your instincts below by sorting these real-world scenarios.

Interactive Challenge: Drag the tasks from the left column into the correct priority quadrant on the right.

Interactive Challenge

Score: 0/4
Task Queue
All tasks sorted!
Q1: Quick Wins
Q2: Major Projects
Q3: Fill Ins
Q4: Thankless
🎉 Perfect Score! You are ready to prioritize.

How to Run a Prioritization Workshop


Prioritization is a team activity. When done alone, it’s just a guess. When done together, it’s a commitment. Follow this expanded framework to ensure team alignment.

1. Brainstorm

Begin by generating a high volume of ideas. Encouraging quantity prevents the team from filtering out potentially innovative solutions too early. At this stage, no idea is "too big" or "too small"—capturing everything ensures team members feel heard.

New Feature
Fix Bugs
Update UI
Mobile App

Question to ask the team

"If we had unlimited resources, what is the first thing we would build?"

2. Define Scales

Calibration is essential to avoid semantic arguments later. A 'large' project for a startup might be a 'small' task for an enterprise. Agreeing on units (e.g., hours vs. complexity points) aligns the team's mental model before the debate begins.

Low Effort
1 Day
High Effort
3 Months

Question to ask the team

"What is a recent example of a 'High Effort' task that bogged us down?"

3. Plotting

This is where the debate happens. As you place tasks, compare them relative to each other rather than in isolation. If two tasks are in the top-right quadrant, ask the team which one truly drives more immediate customer value.

Q1
Q2
📌
Q3
Q4

Question to ask the team

"Is this task truly 'High Impact,' or is it just 'High Urgency'?"

4. The Cut Line

Prioritization implies trade-offs. The 'Cut Line' forces the team to acknowledge finite capacity. Items below the line aren't dead; they are simply not the priority for *this* cycle and go into the backlog.

CUT LINE

Question to ask the team

"If we commit to this new task, what are we agreeing *not* to do?"

🚀 Ready to Facilitate?

You have the theory. Now take the next logical step with these resources.

Download the Toolkit

Don't create the matrix from scratch. Get our free pre-configured templates.

Excel Miro Board PDF

Next: Resource Planning

You've prioritized the "What". Now determine the "When" and "Who" to execute it.

Team Consensus Simulator

See how individual votes (dots) converge to form a team decision. Outliers happen!

Low Impact / Low Effort High Impact / Low Effort

Common Pitfalls

Even with a clear matrix, teams can fall into behavioral traps that undermine the process. Being aware of these cognitive biases is half the battle. Here are the most common ways prioritization goes wrong.

The "Middle" Trap

Avoid placing tasks directly in the center of the grid. It's safe, but useless because it avoids a decision. Force a choice: is it High or Low?

Optimism Bias

Teams consistently underestimate effort. A good rule of thumb: If you think it will take 1 week, plot it as 2 weeks to account for friction.

The Hippo Effect

The "Highest Paid Person's Opinion" often skews the vote. Have leaders vote last (or secretly) to avoid biasing the team.

Ignoring Quick Wins

Don't be so focused on the "Big Picture" that you ignore easy tasks. Quick wins build the momentum needed to tackle the hard stuff.

FREE

Join the 28-Day Lean Challenge

Take your skills to the next level. Join 15,000+ practitioners and get exclusive tools delivered to your inbox.

Daily Lessons 5 Bonus Templates PDF Guides
Start the Challenge

No spam. Unsubscribe anytime.

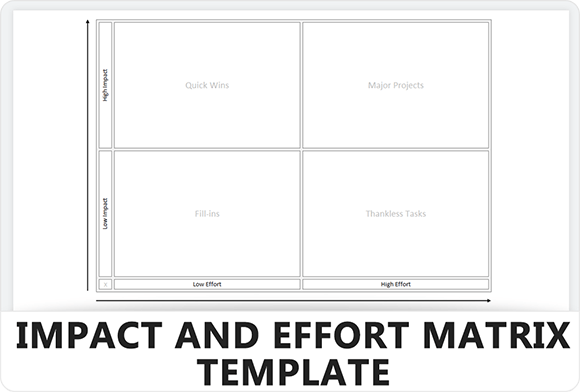
Download Impact and Effort Matrix Template

Feel free to download the premade Impact and effort matrix from our download section to support you with task prioritization. 

Impact and Effort Matrix Template - Feature Image - Learnleansigma

Conclusion

In conclusion, the Impact and Effort Matrix is an useful tool for making data-driven decisions about task prioritization. By using a simple 2×2 grid, you can visualize and categorize tasks into four quadrants: Quick Wins, Major Projects, Fill-Ins, and Thankless Tasks. This facilitates easy identification of tasks that yield the highest impact with the least effort, thus aligning with principles such as the Pareto 80/20 rule. Regularly updating the matrix ensures it remains a dynamic, relevant tool for effective resource allocation.

References

A: An Impact and Effort Matrix is a visual tool used to assess and prioritize tasks, projects, or ideas based on their potential impact and the effort required to implement them. It helps individuals or teams make informed decisions by evaluating the relationship between impact and effort for each task.

A: An Impact and Effort Matrix works by plotting tasks on a two-dimensional grid. The vertical axis represents the impact, indicating the potential outcome or significance of a task. The horizontal axis represents the effort required, considering factors such as time, resources, expertise, or complexity. By assessing and assigning impact and effort scores, tasks are plotted on the matrix, allowing for visual analysis and prioritization.

A: Using an Impact and Effort Matrix provides several benefits. It helps in identifying high-impact, low-effort tasks that should be prioritized. It promotes objective decision-making based on data-driven evaluations. It facilitates resource allocation by highlighting tasks with the most significant impact. Additionally, it increases efficiency by focusing efforts on tasks that deliver the greatest results.

A: Assessing impact and effort requires careful consideration. To determine impact, define specific criteria aligned with your goals and objectives, such as revenue generation, customer satisfaction, or time savings. Evaluate each task based on these criteria and assign impact scores. For assessing effort, consider factors like time, resources, expertise, and complexity. Assign effort scores based on the relative commitment and resources required for each task.

A: The positions of tasks on the Impact and Effort Matrix indicate their prioritization. Tasks in the top left quadrant (high impact, low effort) should be given the highest priority, as they offer significant impact with minimal effort. Tasks in the bottom right quadrant (low impact, high effort) should be deprioritized or reconsidered. The other two quadrants can be evaluated based on specific circumstances and goals.

A: The Impact and Effort Matrix should be regularly reviewed and updated as new tasks, projects, or information become available. It is recommended to revisit the matrix when there are changes in priorities, goals, or resource availability. By keeping the matrix up-to-date, you ensure that it remains a relevant and effective tool for prioritization and decision-making.

A: The Impact and Effort Matrix can be used for both personal tasks and projects. It is a versatile tool applicable to various scenarios, including personal goal setting, time management, and project planning. Whether you are organizing your daily tasks or managing a complex project, the matrix can help prioritize and allocate your resources efficiently.

Daniel Croft-Bednarski

Continuous Improvement Manager
#1 Free Resource Library

Daniel Croft-Bednarski is a Continuous Improvement Manager with a passion for Lean Six Sigma and continuous improvement. With years of experience in developing operational excellence, Daniel specializes in simplifying complex concepts and engaging teams to drive impactful changes.

10+ Years Experience
50+ Projects Led
LSS Black Belt