Guide: ABC Analysis

ABC analysis is a strategic inventory management tool rooted in the Pareto principle, which posits that a minority of causes (around 20%) often lead to a majority of effects (around 80%). Sometimes the terminology of ABC is replaced with Runners (A), Repeaters (B), and Strangers (C) with the runners being the high-volume selling item, repeaters selling fairly regularly and strangers being the rare sales.

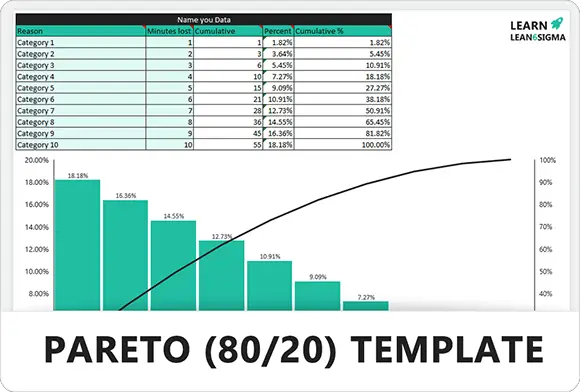
ABC Analysis - Pareto Principle 

In the area of inventory, this translates to a small percentage of items accounting for most of the inventory value. For example, consider managing a retail store with thousands of items ranging from high-end electronics to basic stationery. Using ABC analysis, you discover that only 20% of the items, such as smartphones and laptop computers, account for 80% of the total inventory value.

These are your ‘A’ items, which necessitate close monitoring and optimal stock levels. The following 30% of items, such as headphones and chargers, contribute 15% of the total value and are your ‘B’ items. The remaining 50% of items, such as pens and notepads, account for only 5% of the total value and are classified as ‘C’ items. Prioritizing your ‘A’ items allows you to better manage your inventory, reduce costs, and increase profitability. Amazon is an example company that uses this method to optimize their stock levels and locations of items. In extreme examples fast selling items like toilet roll does not even make it to the shelves.

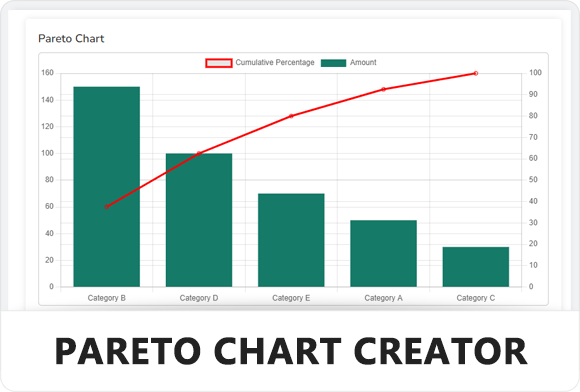
Pareto Chart of ABC Analysis


Through ABC analysis, items are categorized into three groups: ‘A’ items with the highest value, ‘B’ items with moderate value, and ‘C’ items with the lowest value. This method aids businesses in optimizing inventory processes, ensuring that resources are allocated effectively, and that high-value items receive the attention they merit. By implementing this strategy, companies can enhance efficiency, reduce costs, and improve overall inventory management.

Table of Contents

Defining the goals of an ABC analysis is an important first step that sets the tone for the entire process. Clear objectives serve as a road map, providing direction on data collection methods, classification criteria, and subsequent decision-making. Objectives also provide focus, preventing you from becoming distracted or overwhelmed by irrelevant details. Importantly, they provide a framework for evaluating measurable outcomes, allowing you to evaluate the analysis’s effectiveness in real-time.

Start by identifying the key challenges or pain points your organization faces in inventory or resource management. Is it high carrying costs, frequent stockouts, or inefficient order fulfillment? Once you’ve pinpointed the issue, articulate your objectives in a clear and concise manner. For instance, if you aim to reduce inventory costs, your objective could be: “To categorize inventory items in a way that prioritizes reducing holding and ordering costs by X% within Y months.”

By setting well-defined objectives, you’re not just preparing for the ABC analysis; you’re ensuring that the results will be actionable and aligned with your business goals.

In the logistics industry, the goal of ABC analysis could be: “To reduce overall shipping costs and delivery times by identifying key routes and freight types in our distribution network. Within the next six months, we hope to reduce shipping costs by 15% and increase on-time delivery rates to 98%.” This goal will direct data collection on route efficiencies, cargo types, and shipping frequencies, resulting in focused and measurable results.

Step 2: Gather Data

The step of gathering data in ABC analysis is fundamental to the entire process, serving as the basis upon which the analysis is built. The quality and comprehensiveness of the data you collect will directly influence the reliability and accuracy of your analysis.

What Type of Data to Collect

  1. Item Identifier (SKU or Item ID): This unique identifier allows you to track and manage each item or service, ensuring you’re analyzing the correct entity.
  2. Annual Consumption or Usage Quantity: This metric reflects how much of an item is used or sold over a year. It’s vital for determining an item’s weightage in the analysis.
  3. Cost Per Unit: This is the unit cost of purchasing or producing an item. Knowing this helps you gauge the financial impact of each item in your inventory or service list.

The step of gathering data in ABC analysis is fundamental to the entire process, serving as the bedrock upon which the analysis is built. The quality and comprehensiveness of the data you collect will directly influence the reliability and accuracy of your analysis.

What Type of Data to Collect

  1. Item Identifier (SKU or Item ID): This unique identifier allows you to track and manage each item or service, ensuring you’re analyzing the correct entity.
  2. Annual Consumption or Usage Quantity: This metric reflects how much of an item is used or sold over a year. It’s vital for determining an item’s weightage in the analysis.
  3. Cost Per Unit: This is the unit cost of purchasing or producing an item. Knowing this helps you gauge the financial impact of each item in your inventory or service list.

In the context of a logistics business, you might also consider additional variables like shipping costs, delivery times, and route efficiencies.

How Much Data is Needed

The amount of data needed depends on the scale of your operation and the objectives set. Generally, you’ll want data that covers a sufficiently long period to be representative—usually at least a year’s worth to capture seasonal variations. However, if you’re in a rapidly changing business environment, a shorter time frame may be more relevant.

Data Sources

  1. Inventory Management Systems: Modern systems often have built-in reporting features that can provide this data.
  2. Sales and Procurement Teams: They can offer insights into consumption patterns and costs.
  3. Historical Data: Past invoices, orders, and usage reports can also be excellent sources.

By investing the time and resources to gather comprehensive and accurate data, you lay a strong foundation for a successful ABC analysis, enabling you to make informed decisions that align with your business objectives.

How your data table might look

Shipment IDRouteCargo TypeAnnual ShipmentsCost Per Shipment ($)
SHP001Route1Electronics500200
SHP002Route2Textiles300150
SHP003Route3Food1000100
SHP004Route1Machinery200300
SHP005Route4Chemicals50500

Step 3: Calculate Annual Consumption Value

The Annual Consumption Value (ACV) calculation is a critical step in ABC analysis because it transforms raw data into meaningful, actionable insights. ACV provides a monetary perspective on the importance of each item in your inventory or, in the case of our logistics example, each shipment type. This value is useful for prioritizing items based on their financial impact on the business rather than just transaction frequency or volume.

Calculation

The formula to calculate Annual Consumption Value is straightforward:

Annual Consumption Value=Annual Usage Quantity×Cost Per Unit


This formula multiplies the annual usage or frequency of each item by its cost to give you a total annual value for that specific item or service.
 

Example Continuation

Continuing with our logistics example, let’s take Shipment ID SHP003:

  • Annual Shipments: 1000
  • Cost Per Shipment: $100

Using the formula, the Annual Consumption Value for SHP003 would be:

Annual Consumption Value for SHP003=1000shipments×100USD/shipment=100,000USD
 

This value tells us that SHP003 has a significant financial impact on the business, contributing $100,000 annually. It becomes a crucial metric for categorizing and ranking items in the next steps of the ABC analysis. Knowing this value allows us to allocate resources and strategies effectively to manage this particular shipment type.


Step 4: Rank Items Based on Annual Consumption Value

Ranking items by their Annual Consumption Value (ACV) is a decisive phase in ABC analysis. This step serves two primary purposes:

  1. Clear Perspective: The ranking provides a crystal-clear view of which items, or in our logistics example, which shipment types, carry the most significant financial weight. This clarity helps in focusing your attention and resources on the most impactful areas.
  2. Resource Allocation: By identifying which shipment types are most valuable, you can allocate resources like manpower, time, and capital more judiciously. This ensures that high-value shipments receive the attention they merit.

Continuing with the Example

In our logistics example, we calculated an ACV of $100,000 for SHP003. Assuming we’ve done similar calculations for other shipment types, we sort them based on these values. For instance:

  • SHP003: $100,000
  • SHP001: $100,000
  • SHP004: $60,000
  • SHP002: $45,000
  • SHP005: $25,000

Ranking ACV

Step 5: Calculate Cumulative Consumption Value and Percentage

This step focuses on understanding the cumulative impact of items based on their Annual Consumption Value (ACV). Calculating the cumulative value and percentage allows you to see how a select group of items can significantly contribute to the total ACV. 

For instance, in our logistics example, if SHP003 and SHP001 account for $100,000 each, their cumulative value is $200,000. 

This cumulative perspective is essential as it sets the stage for the next critical part of ABC analysis: categorizing items into A, B, and C groups. By understanding which items collectively contribute the most, you can more effectively allocate resources and prioritize your inventory management strategies.


ABC Pareto

Step 6: Categorize Items into A, B, and C Groups

Now, you’ll use the cumulative percentages to segregate items into three distinct categories and we do this because:

  • Strategic Management: Categorizing items into A, B, and C groups allows you to develop tailored inventory or logistics management strategies for each category. This helps in optimizing the allocation of resources like capital, manpower, and time.
  • Resource Optimization: By knowing which items are most valuable (A), moderately valuable (B), and least valuable (C), you can direct more resources and attention to high-impact items and less to low-impact ones.
  • Differentiated Approach: Categorization enables a nuanced management strategy. High-value items can receive intense scrutiny and quick response times, whereas less significant items might have longer review cycles.

How to Do It

  • A Items: Starting from the top of your sorted list, mark items as ‘A’ until the cumulative percentage reaches around 70-80% of the total consumption value. In our example, SHP003 and SHP001 would be ‘A’ items as they account for a significant portion of the total value.
  • B Items: Continue marking the next items as ‘B’ until you account for an additional 15-25% of the total consumption value. In our case, SHP004 would fall under this category.
  • C Items: The remaining items are labeled as ‘C’. These are the items that individually contribute the least but may still be significant in volume. SHP002 and SHP005 would be ‘C’ items in our example.

Obviously, our example does not have many items within it to breakdown into ABC, but hopefully this make sense and would be just the same on a larger scale.

However, it is important to remember that these percentage breakpoints are not fixed and can be adjusted according to your specific business needs. Some businesses may use a 65-20-15 or a 75-15-10 distribution based on their operational priorities.

By following this categorization process, you create a framework for managing each type of item or shipment in a way that aligns with its financial and operational impact on the business.

Step 7: Review and Adjust

Every inventory item has both quantitative and qualitative attributes. ABC analysis primarily considers the quantitative aspect, but real-world situations may require adjustments based on qualitative factors.

Why It’s Important:

  • Multi-Dimensional Value: ABC analysis initially categorizes items based on quantitative factors like Annual Consumption Value (ACV). However, some items may have qualitative attributes that are critical to operations. For instance, an item in category ‘C’, like SHP005, might be essential during peak seasons and thus might warrant special attention.
  • Dynamic Business Environment: Market conditions, customer preferences, and supply chain dynamics are ever-changing. A disruption in the supply chain could suddenly make a ‘B’ or ‘C’ category item, such as SHP004, critical to business continuity.
  • Strategic Alignment: As business strategies evolve, the importance of certain items may change. An item initially in category ‘B’ might become more critical due to a new business partnership, warranting its move to category ‘A’.

How to Do It:

  • Consult with Stakeholders: Engage with various departments like procurement, sales, and operations to understand the qualitative factors affecting each item. For example, your procurement team might inform you that SHP002 has a long lead time, which could warrant its reclassification.
  • Re-categorize as Needed: Based on the insights gathered, make the necessary adjustments. If SHP005 is the only shipment type compatible with a key customer’s requirements, it might be moved to the ‘A’ category despite its lower ACV.

By regularly reviewing and adjusting your ABC categorization, you align your inventory management practices not only with financial metrics but also with operational realities and strategic objectives.

Step 8: Implement Inventory Strategies

With items neatly categorized, you can now apply tailored inventory management strategies to each group.

For A Items:

Items like SHP003 and SHP001 fall under this category due to their high Annual Consumption Value.

  • Tight Inventory Control: Any disruption in the availability of these items can have severe financial repercussions. Therefore, it’s vital to monitor stock levels meticulously and forecast demand with high precision.
  • Frequent Review Cycles: These items need to be reviewed more often to ensure that the stock levels are in sync with the demand. Early detection of any anomalies can help in taking timely corrective measures.
  • Optimal Order Quantities: Calculating the optimal ordering quantities for these items is critical to balance the costs associated with ordering and holding inventory.
  • Supplier Relationships: Given their high value, maintaining a robust relationship with suppliers is essential to ensure consistent quality and timely deliveries.

For B Items:

SHP004 falls under this category, which requires moderate oversight.

  • Moderate Control: While important, ‘B’ items don’t demand as rigorous control as ‘A’ items. However, they shouldn’t be neglected.
  • Balanced Review & Order Strategies: A balanced approach in ordering and reviewing is key for these items.

For C Items:

Items like SHP002 and SHP005 have the least financial impact but can be significant in volume.


  • Bulk Ordering: Given their lower cost, these can be ordered in bulk to leverage economies of scale.
  • Longer Reorder Cycles: These items can afford longer reorder cycles, thereby reducing administrative efforts.
  • Minimal Reviews: Due to their lower financial impact, frequent reviews may not be necessary for these items.

By implementing these tailored strategies, you can ensure efficient and effective inventory management that aligns with the financial and operational goals of your logistics business.

Conclusion

ABC Analysis serves as a vital framework for effective inventory management, facilitating optimized resource allocation and cost reduction. Built on the Pareto principle, it allows businesses to categorize inventory items into three main groups—’A’, ‘B’, and ‘C’—based on their financial impact and usage. This hierarchical classification enables targeted inventory strategies that prioritize high-value items while not neglecting lower-value but still essential goods. 

The methodology’s structured ten-step process ensures a comprehensive approach, from objective setting to continuous improvement. However, the real potency of ABC Analysis lies in its adaptability.

It not only relies on quantitative metrics but also accommodates qualitative factors, allowing for flexibility in a dynamic business environment. Regular updates and cross-departmental collaboration further enhance its effectiveness, making it an indispensable tool in modern inventory management.


Additional Useful Information on ABC Analysis

Beyond Inventory: Versatile Applications

While ABC Analysis is popular in inventory management, its applications extend into various fields:

  1. Time Management: Prioritizing tasks as A, B, or C can help manage your day effectively.
  2. Customer Segmentation: Classify customers based on their lifetime value or purchase frequency.
  3. Risk Management: Categorize risks based on their potential impact on the organization.

The 80/20 Principle

ABC Analysis is often linked to the Pareto Principle, or the 80/20 rule, which states that 80% of the effects come from 20% of the causes. In inventory, this might mean that 80% of the value is tied up in 20% of the items (Category A).

ABCXYZ Analysis: A Hybrid Approach

This approach combines ABC Analysis with XYZ Analysis, which categorizes items based on the predictability of their demand. This results in a more nuanced understanding of inventory or any other set of items you’re analyzing.

Incorporation of Technology

Digital tools can automate the process of ABC Analysis. For instance, machine learning algorithms can continually update the categorization based on real-time data.

Best Practices

  1. Regular Updates: The categorizations in ABC Analysis are dynamic. Regularly update your analysis to reflect current conditions.
  2. Multi-Criteria Analysis: Consider multiple factors like cost, volume, and lead time for a more accurate classification.
  3. Engage Stakeholders: Include cross-functional teams in the analysis process for a comprehensive perspective.

References

A: ABC Analysis is a method used in inventory management to categorize items into three groups based on their value and importance. ‘A’ items are the most valuable, ‘B’ items have moderate value, and ‘C’ items are the least valuable. This allows businesses to prioritize resources and focus on managing the most crucial items.

A: The value of an item in ABC Analysis is usually determined by multiplying its annual usage or consumption quantity by its cost per unit. This provides the total annual consumption value, which helps in categorizing the item.

A: ABC Analysis helps businesses optimize inventory management processes. By focusing resources on high-value items and streamlining processes for lower-value items, companies can reduce costs, improve stock availability, and enhance overall efficiency.

A: Yes, while the general guideline is that ‘A’ items represent 70-80% of the total value, ‘B’ items 15-25%, and ‘C’ items 5-10%, these percentages can be adjusted based on specific business needs or industry standards.

A: No, for ABC Analysis to remain effective, it should be revisited regularly. Market dynamics, consumption patterns, and business strategies can change, so it’s essential to update the categorization to reflect current business needs.

A: Absolutely. While the primary categorization is based on quantitative data, certain items might be deemed critical due to qualitative reasons, such as their role in production, even if they have a low consumption value.

Author

Daniel Croft

Daniel Croft

Daniel Croft is a seasoned continuous improvement manager with a Black Belt in Lean Six Sigma. With over 10 years of real-world application experience across diverse sectors, Daniel has a passion for optimizing processes and fostering a culture of efficiency. He's not just a practitioner but also an avid learner, constantly seeking to expand his knowledge. Outside of his professional life, Daniel has a keen Investing, statistics and knowledge-sharing, which led him to create the website learnleansigma.com, a platform dedicated to Lean Six Sigma and process improvement insights.

All Posts

Download Template

Use our tool

Free Lean Six Sigma Templates

Improve your Lean Six Sigma projects with our free templates. They're designed to make implementation and management easier, helping you achieve better results.

Other Guides