What is a Pareto Chart

Guide: Pareto Chart

Author's Avatar

Daniel Croft

Daniel Croft is an experienced continuous improvement manager with a Lean Six Sigma Black Belt and a Bachelor's degree in Business Management. With more than ten years of experience applying his skills across various industries, Daniel specializes in optimizing processes and improving efficiency. His approach combines practical experience with a deep understanding of business fundamentals to drive meaningful change.

Pareto Charts serve as a key tool in quality control and continuous improvement efforts. This visual tool, underpinned by the Pareto Principle, helps pinpoint the critical factors that contribute most significantly to a problem. By sorting issues from the most to the least frequent and superimposing cumulative percentages, Pareto Charts offer a clear, prioritized roadmap for problem-solving. They transform complex datasets into actionable insights, ensuring that effort and resources are focused where they can have the most substantial impact. This guide dives into the essence of Pareto Charts, their composition, and how they apply the Pareto Principle to foster strategic improvements across diverse industries.

Table of Contents

What is a Pareto Chart?

A Pareto Chart is a visual tool used in continuous improvement and quality control to help identify the most frequent factors contributing to an overall effect. It is a type of Bar Chart that sorts frequencies from high to low and combines a line chart of cumulative percentagess to measure the Pareto Principle

The Pareto Principle

The Pareto Chart is based on the Pareto Principle, a concept developed by economist Vilfredo Pareto in the late 19th and early 20th centuries. Pareto initially identified that approximately 80% of Italy’s land was owned by 20% of the population.

He then further identified in different industries that similar distributions applied, where the minority of causes, inputs, or efforts led to the majority of results, outcomes, or rewards. Pareto’s work was initially intended for use in economics but quickly gained traction in a range of fields such as business, engineering, health care, and quality control.

Key Components of a Pareto Chart

  • Bars: Each bar represents a type of defect or problem, with the height reflecting the frequency or impact of that issue. The bars are arranged so that the longest bars (representing the most significant problems) appear first.
  • Line Graph: Superimposed on the bar chart is a line graph that displays the cumulative total of the issues as you move from left to right. This helps identify the point at which the most critical issues have been covered.
  • Categories: The categories (e.g., types of defects or customer complaints) are often issues that can be addressed or controlled. By focusing on the categories to the left (the tallest bars), you can achieve a greater overall effect.

How the Pareto Principle is Applied in Business

In quality control or continuous improvement, the principle suggests that by solving 20% of the problems, you could potentially eliminate 80% of the issues. This would mean that a small number of causes often lead to a large part of the problem.

For example, below:

Example Pareto Chart

Insights from the Chart:

  • Defect Frequencies: The distribution starts with ‘Misalignment’ as the most frequent defect, followed by ‘Electrical Failure’, with each subsequent defect type decreasing in frequency more naturally.
  • Cumulative Percentage: The cumulative line shows that the first two defect types (‘Misalignment’ and ‘Electrical Failure’) contribute significantly to the total number of defects, maintaining the essence of the 80/20 rule.
  • 80% Threshold: The red dashed line indicates where approximately 80% of the problems could theoretically be resolved by addressing the issues represented to the left of where the line intersects with the cumulative percentage graph.

When to Use a Pareto Chart?

Pareto charts are a key tool used in Lean Six Sigma and will often find them used in the analysis phase of a DMAIC project or the gap analysis phase of an A3 Problem-solving improvement. Pareto charts are most useful in situations where data-driven decisions need to be made.

Examples of situations in which a Pareto Chart can be Used

Data-Driven Analysis: When you have data that can be quantified and categorized, such as defects, customer complaints, or any other types of non-conformities, The Pareto can help visualize the frequencies in the data and identify the critical few to focus on.

Problem Identification: It helps in distinguishing between the “vital few” problems that occur frequently and the “trivial many” that happen rarely.

Process Complexity: In complex processes where multiple factors could contribute to a problem, a Pareto chart can simplify the data, making it easier to identify and prioritize issues.

How to Create a Pareto Chart?

Creating a Pareto Chart is a systematic process that involves data collection, chart construction, and analysis. Here’s a detailed walkthrough of each step

Step 1: Data Collection

The first step in creating a Pareto chart, if you have not already, is to collect data. Therefore, determine what you want to analyze with the Pareto chart. This could be a range of problems, such as production defects or customer complaints. Determine the scope of the problem and decide if it is a specific part of the process, a product line, or time period you are analyzing. 

Identify the frequent causes of the problem; the data you have may already tell you this. Otherwise, you will need to brainstorm the category list and future data collection. With this you should group similar issues together to form categories such as, ‘machine breakdowns’ could include subcategories like ‘electrical failures’, ‘mechanical wear’.

During the data collection, you will need to collect data on each cause, which will be the count of times they occur or the number of minutes of downtime associated with each cause.

Step  2: Construction the Chart

To follow the steps of constructing a chart, you can use our example data set if you dont have data available: Example Pareto Data

For this you simply need two columns:

Column A: Category, such as defect type

Column B: Frequency: the number of times the frequency occurred or the number of minutes the problem caused downtime for example

Pareto Example step - data

Once you have this data, select all the data, both columns and all the rows, and click Insert (on the top bar) > Click Recommended Charts > Select the Pareto Chart > Click Ok.

Selecting Pareto Chart

You will now have a Pareto chart like the example below

Complete Pareto Chart

Step 3: Analyzing the Chart

Identify “Vital Few”

  • Assess the Curve: Look for the point at which the cumulative percentage line starts to level off; this is often referred to as the “elbow” of the curve.
  • Vital Few: The causes to the left of this point are your “vital few”—the most significant causes that you should address first.

Using the example chart above the vital few would be paint flaws, scatches, and dents, which account for around 80%.

Focus on the Critical Causes

  • Prioritize: These are the issues that, if solved, could lead to the greatest improvements in the system.
  • Action Plan: Develop action plans for the critical causes, ensuring that solutions are practical and can be implemented effectively.

Free Pareto Chart Tools on LearnLeanSigma

At LearnLeanSigma, we understand that not everyone has access to sophisticated software like Excel or the time to become proficient in it. That’s why we offer user-friendly, free tools to create and download Pareto Charts, helping you to visualize and prioritize problems quickly and efficiently.

Free Pareto Template Download

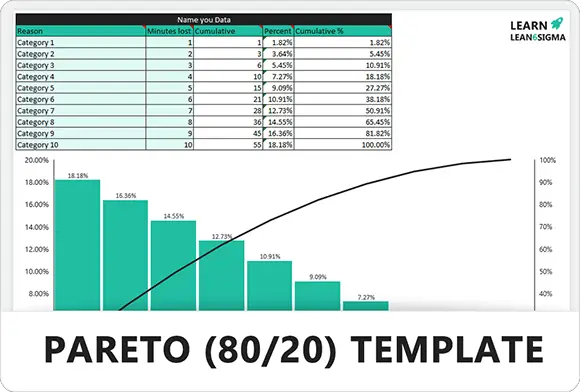
Pareto 80-20 Template - Feature Image - Learnleansigma

Simplify Your Analysis: With our free Pareto template, you can easily input your data and let the template do the rest. It’s a plug-and-play solution that requires no advanced Excel skills.

How It Works:

  1. Visit our Pareto Template Download page.
  2. Download the template to your computer.
  3. Input your data into the predefined fields.
  4. The template will automatically generate a Pareto Chart for you.
  5. Use the chart to analyze and prioritize improvement efforts.

Free Online Pareto Chart Creator

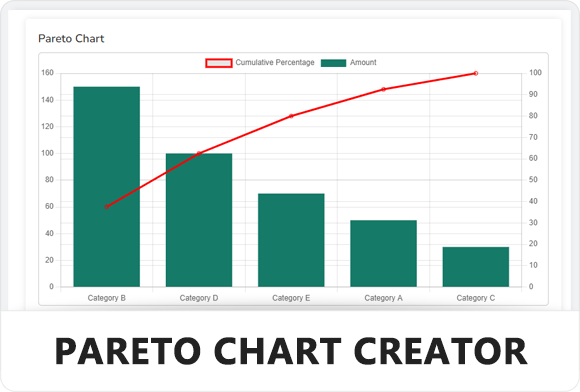
Create Pareto Charts Anywhere: Our online Pareto Chart creator allows you to create a Pareto Chart directly from your browser. This tool is perfect for those who need to generate a Pareto Chart on the go or prefer not to download software or templates.

Pareto Chart Creator - Feature Image - Learnleansigma

How It Works:

  1. Access the Online Pareto Chart Creator.
  2. Enter your categories and their corresponding values.
  3. Adjust the settings to fit your preferences.
  4. Generate the chart with the click of a button.
  5. Download the generated Pareto Chart for your reports or presentations.

Benefits:

  • Accessible from any device with internet connectivity.
  • No downloads required.
  • Instantly generates downloadable Pareto Charts.

Conclusion

The Pareto chart is more than just a tool, by highlighting the ‘vital few’ from the ‘trivial many’, Pareto Charts allow businesses to focus their efforts into the most impactful areas. With our free Pareto Chart tools, this process becomes accessible to all, removing barriers to sophisticated software and streamlining the journey towards excellence. Whether through a downloadable template or an online creator, LearnLeanSigma offers the resources to visualize, prioritize, and act upon the data that matters, promoting a cycle of continuous improvement and sustained success.

References

  • Harvey, H.B. and Sotardi, S.T., 2018. The pareto principle. Journal of the American College of Radiology15(6), p.931.

Additional Useful Information on Pareto Charts

Variants of Pareto Charts

  1. Weighted Pareto Chart: This version of the chart takes into account not just the frequency of occurrences but also the magnitude of each issue’s impact.

  2. Nested Pareto Chart: In some situations, each category in the Pareto chart can be broken down into sub-categories, allowing for deeper analysis.

  3. Comparative Pareto Charts: These charts compare the same categories across different time periods or scenarios, providing a dynamic view of how issue importance shifts over time.

Integration with Lean Six Sigma

In the Lean Six Sigma methodology, Pareto Charts are often used during the “Analyze” phase of the DMAIC cycle to identify the most critical issues to focus on for maximum impact.

Practical Tips for Creating Pareto Charts

  1. Accurate Data Collection: Ensure that the data you are using is accurate and up-to-date to make your Pareto chart as effective as possible.

  2. Use of Color: Consider using varying shades or colors to represent different categories or levels of severity. This makes the chart easier to read and interpret.

  3. Annotations: Adding labels or notes can provide context and make it easier for team members who are not as familiar with the data.

A: A Pareto chart is a graphical tool used for prioritizing and analyzing the relative importance of different factors or problems in a dataset. It is based on the Pareto principle, also known as the 80/20 rule, which states that roughly 80% of the effects come from 20% of the causes.

A: To construct a Pareto chart, you first need to identify and list the different factors or categories you want to analyze. These factors should be mutually exclusive and collectively exhaustive. Then, you gather data on the frequency or impact of each factor and arrange them in descending order. The factors are plotted on the x-axis, while the frequency or impact is represented on the y-axis. A bar graph is used to visualize the data, with the bars arranged in descending order from left to right.

A: The main purpose of a Pareto chart is to identify and prioritize the most significant factors or problems in a dataset. It helps you focus your efforts on the vital few rather than the trivial many. By visualizing the data in a Pareto chart, you can quickly identify the factors that contribute the most to an outcome or issue, allowing you to allocate resources efficiently and address the root causes effectively.

A: A Pareto chart typically has two key features:

  1. Bars: The chart consists of bars representing each factor or category, arranged in descending order based on their frequency or impact. The length of the bars represents the relative importance of each factor.
  2. Cumulative Percentage Line: A cumulative percentage line is often included in the chart. It shows the cumulative percentage of the total frequency or impact as you move from left to right on the chart. This line helps identify the point at which the most significant factors begin to level off.

A: A Pareto chart can provide several insights, including:

  • Identification of the vital few factors: It highlights the factors that have the most significant impact, allowing you to prioritize your actions accordingly.
  • Visualization of cumulative contribution: The cumulative percentage line shows how much the selected factors contribute to the overall problem, helping you understand the cumulative impact.
  • Focus on the key areas for improvement: By identifying the top factors, you can focus your efforts and resources on addressing the root causes, leading to more effective problem-solving.

A: Pareto charts have a wide range of applications across various industries, including:

  • Quality improvement: Identifying the most frequent defects or problems to focus on improving quality.
  • Process optimization: Determining the most significant process bottlenecks or inefficiencies.
  • Customer complaints analysis: Prioritizing the most common customer complaints for addressing customer satisfaction issues.
  • Risk management: Identifying the most critical risks or hazards in a system to prioritize risk mitigation strategies.
  • Resource allocation: Allocating resources based on the most impactful factors to maximize efficiency and effectiveness.

A: Yes, there are a few limitations to consider when using Pareto charts:

  • Subjectivity in factor selection: The choice of factors and their categorization may involve subjectivity, which can impact the outcomes of the analysis.
  • Lack of context: Pareto charts provide a high-level overview and may not capture the full context of the underlying factors. Additional analysis may be required for a comprehensive understanding.
  • Focus on historical data: Pareto charts are typically based on historical data, so they may not account for changes in circumstances or new factors that emerge over time.
  • Ignoring interactions
 

Author

Daniel Croft

Daniel Croft

Daniel Croft is a seasoned continuous improvement manager with a Black Belt in Lean Six Sigma. With over 10 years of real-world application experience across diverse sectors, Daniel has a passion for optimizing processes and fostering a culture of efficiency. He's not just a practitioner but also an avid learner, constantly seeking to expand his knowledge. Outside of his professional life, Daniel has a keen Investing, statistics and knowledge-sharing, which led him to create the website learnleansigma.com, a platform dedicated to Lean Six Sigma and process improvement insights.

All Posts

Download Template

Download Template

Free Lean Six Sigma Templates

Improve your Lean Six Sigma projects with our free templates. They're designed to make implementation and management easier, helping you achieve better results.

Other Guides