What is a Root Cause Analysis

Guide: Root Cause Analysis

Author's Avatar

Author: Daniel Croft

Daniel Croft is an experienced continuous improvement manager with a Lean Six Sigma Black Belt and a Bachelor's degree in Business Management. With more than ten years of experience applying his skills across various industries, Daniel specializes in optimizing processes and improving efficiency. His approach combines practical experience with a deep understanding of business fundamentals to drive meaningful change.

Guide: Root Cause Analysis

Root Cause Analysis (RCA) is a key tool in continuous improvement, acting as a systematic approach to identify and tackle the underlying issues behind problems. RCA aims not only to provide a temporary fix but to offer long-lasting solutions by addressing the root causes.

RCA, such as the Fishbone Diagram, the 5 Whys, and FMEA. Whether you’re looking to solve complex challenges or improve cost-efficiency, this guide will offer understanding of how to identify the root cause of problems with useful Lean Six Sigma tools.

What is Root Cause Analysis?

Root Cause Analysis, often referred to as RCA, is like being a detective for problems in your business or project. Imagine you have a leaking pipe in your house. You could keep mopping up the water every time it leaks, but that’s not really solving the issue. The right thing to do is find out why it’s leaking in the first place and fix that. RCA works the same way; it helps you find out the “why” behind a problem so you can fix it for good.

Structured Approach

When we say RCA is a “structured approach,” we mean it’s not just random guesswork. It’s a planned way to dig deep into a problem. You will follow certain steps and use specific tools to figure out what’s really going on. This makes sure you’re not just treating the “symptoms” of the problem, like mopping up water from a leak, but you’re finding out why the problem is happening in the first place.

RCA Process (high level)

Identify Underlying Reasons

The “underlying reasons” are the real culprits behind a problem. For example, if a machine in a factory keeps breaking down, simply repairing it each time isn’t enough. You need to find out why it’s breaking down. Is it old? Are people using it wrong? RCA helps you answer these kinds of questions.

Identifying a root cause

Long-term Solutions

The coolest part about RCA is that it’s focused on long-term solutions. Once you know the root cause of a problem, you can create a fix that will (hopefully) make sure it never happens again. This is way better than just putting out fires all the time.

By understanding and using RCA, you’re not just stopping at “What is the problem?” You’re going the extra mile to ask, “Why did this problem happen?” and “How can we make sure it doesn’t happen again?” That’s a game-changer in making things better for the long run.

Importance of Root Cause Analysis

Understanding the “why” behind a problem isn’t just something that’s nice to do; it’s crucial for several reasons.

Problem Solving

Imagine you have a puzzle, but all the pieces are jumbled up. Trying to see the whole picture from this mess would be overwhelming, right? RCA is like sorting these puzzle pieces into groups; maybe by color or edge pieces versus middle pieces. When you break down a big, complex problem into smaller parts, it becomes much easier to solve. RCA helps you dissect a problem into its basic elements so you can tackle each one individually. This makes it easier to find out what’s really going wrong and fix it.

Cost-Efficiency

You know the saying, “Time is money”? Well, constantly fixing the same problem over and over again is like throwing both time and money down the drain. If you use RCA to get to the bottom of an issue and solve it at its root, that issue is less likely to come back. This means you spend less time, effort, and money on it in the future. For a business, this is a big deal because it means you can focus on growing and improving, rather than fixing the same old problems. This is where most businesses fail to progress as they spend the day to day activities fire fighting repreated problems.

Quality Improvement

Let’s say you run a bakery, and you notice that your chocolate chip cookies are coming out burnt too often. You could just toss the burnt cookies and make a new batch, but that doesn’t stop the next batch from burning too. If you use RCA to find out why they’re burning—maybe the oven temperature is wrong or the baking time is too long—you can fix that issue and make perfect cookies every time. This makes your customers happy and keeps them coming back. In the same way, RCA helps you improve the quality of your products or services by fixing the real issues, not just the symptoms. This leads to happier customers and better reviews, which are good for any business.

Types of Root Cause Analysis Methods

When it comes to finding the real reason behind a problem, one size doesn’t fit all. Different situations may require different approaches. That’s why there are several methods for conducting RCA. Let’s explore three of the most commonly used methods.

Fishbone Diagram (Ishikawa)

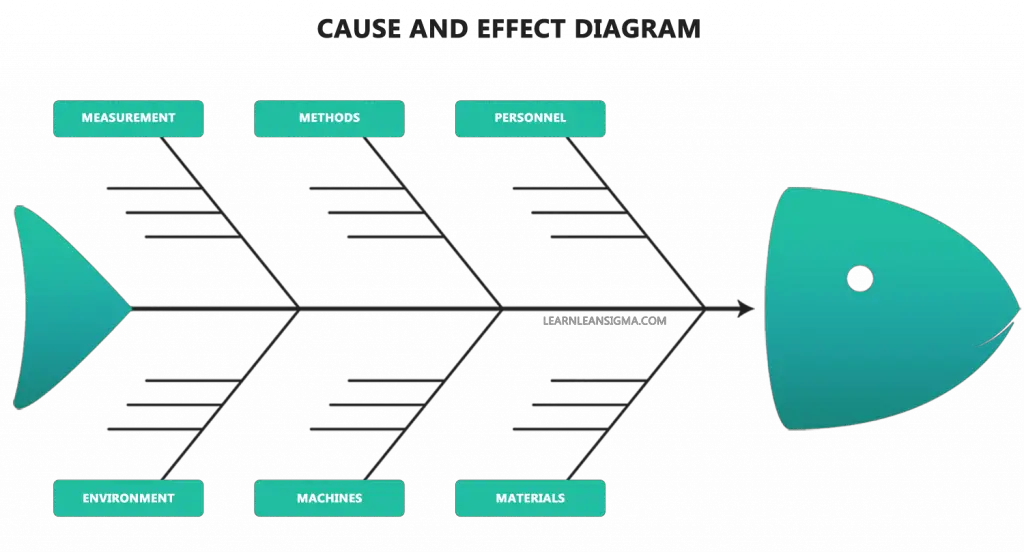
Imagine a fish. The head represents the problem you’re facing, and the bones branching off from the fish’s spine are the possible causes of the problem. This is what a Fishbone Diagram looks like. Also known as an Ishikawa Diagram or Cause and Effect Diagram, this method helps you visually break down a problem into different categories or “themes.”

Fishbone diagram Lean Six SIgma Tool Ishikawa Diagrams Root Cause Analysis (RCA) Fish Bone Diagram Ishikawa Diagram Cause and Effect Diagram

For example, if you’re running a restaurant and customers are complaining about long wait times, you could use a Fishbone Diagram to categorize potential causes into themes like ‘Staffing,’ ‘Kitchen Efficiency,’ ‘Order Process,’ etc. Within each theme, you list out possible root causes. This helps you see the whole picture and makes it easier to identify where the real issue might be coming from.

You can learn more about the fishbone diagram process with our guide

The 5 Whys

Remember being a curious kid and asking “Why?” about everything? The 5 Whys method is pretty much the same. Start with the problem at hand and ask “Why did this happen?” Once you have an answer, ask “Why?” again, digging deeper. Keep asking “Why?” until you’ve asked it five times or until you reach a point where the root cause becomes clear.

For example, if a machine in a factory stops working, you could ask:

  • Why did the machine stop? (Answer: The motor burned out.)
  • Why did the motor burn out? (Answer: The motor was overloaded.)
  • Why was the motor overloaded? (Answer: The machine was running at high capacity for too long.)
  • Why was the machine running at high capacity for so long? (Answer: There was a backlog of orders.)
  • Why was there a backlog of orders? (Root Cause: Poor planning and scheduling.)
  • This helps you trace back the chain of events to find the root cause of the problem.

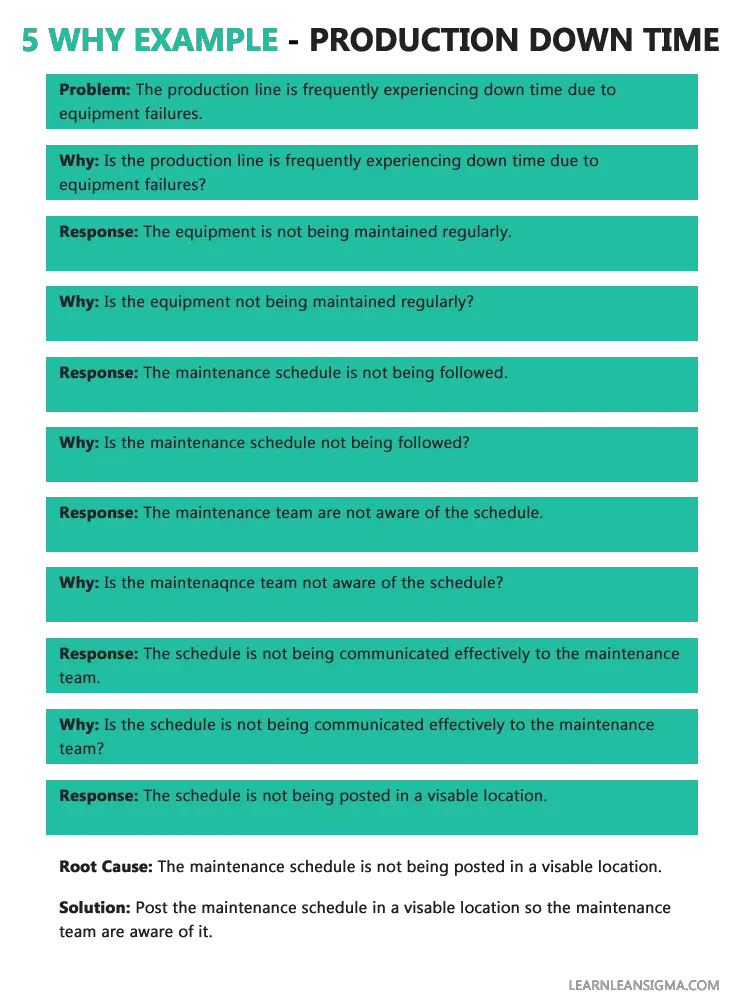
5 Whys Corrective and Preventive Actions Lean Six Sigma Tools Example of a 5 whys analysis bening done on production down time

You can learn more about the 5 Whys process with our guide.

FMEA (Failure Modes and Effects Analysis)

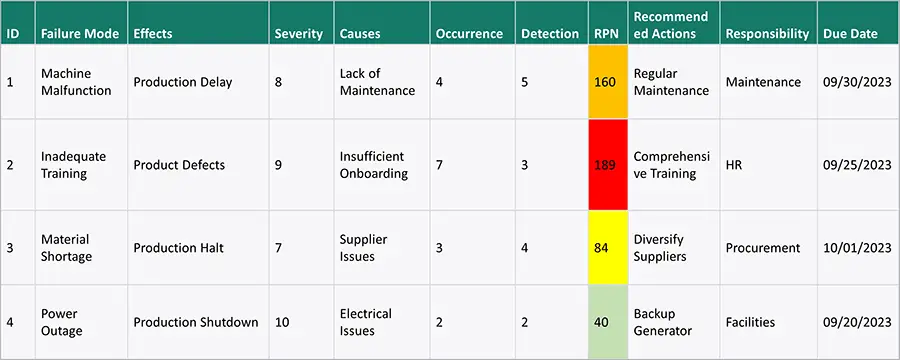
FMEA is like looking into a crystal ball to see what could go wrong in the future. It’s a way to evaluate different ways a process or product could fail and to understand the impact of those failures. You list out all possible failure modes, how likely they are to happen, how bad the impact would be, and how well you could detect them before they cause problems. This helps you prioritize which potential issues need immediate attention.

Below is an example from a manufacturing business. The higher the RPN (risk priority number) the more important it is to address the issue.

FMEA Example

You can learn more about the FMEA with our guide

Selecting an RCA method

If you are new to root cause analysis it can be difficult knowing which approach to use to solve your problem. This can be made simpler by considering the below

RCA Decision Tree

Is the problem simple and straightforward?

The Five-Step RCA Process

RCA isn’t something you can do haphazardly; it requires a structured approach to be effective. That’s where the Five-Step RCA Process comes in handy. It provides a roadmap to tackle your problem methodically. Let’s start by discussing the first step in detail.

Step 1: Define the Problem

Before you can find a solution to any problem, you need to know exactly what that problem is. You’d be surprised how often people jump to fixing things without clearly understanding what’s wrong in the first place. Defining the problem is like setting the GPS before going on a trip; it sets the direction for everything that follows. Here’s how to go about it:


Be Specific

Let’s say you’re running a coffee shop, and you notice that customers aren’t coming back. Simply saying, “Business is slow,” is too vague. A more specific problem statement would be, “Customer return rate has dropped by 20% in the last two months.”

Use Data

Numbers don’t lie. Whenever possible, use data to define your problem. In the coffee shop example, you could look at sales records, customer surveys, or loyalty program participation to pinpoint the decline.

Consider the 5 Ws

  • Who: Who is affected by this problem? Is it just one department, the whole company, or maybe your customers?
  • What: What exactly is the issue? Try to describe it in one sentence.
  • Where: Where is this problem occurring? Is it in a specific location or across various places?
  • When: When did you first notice this problem? Is it a constant issue or does it happen only at certain times?
  • Why: At this stage, you may not know the root cause, but you might have some initial thoughts on why the problem might be occurring.

Write it Down

Once you’ve gathered all this information, write down your problem statement. This serves as a reference point for everyone involved in the RCA process, making sure everyone is on the same page.

After gathering all the relevant information, the problem statement for RCA could be:

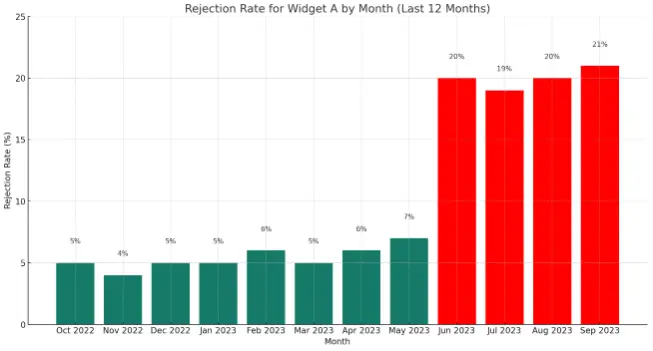
“The rejection rate for Widget A produced on Line 3 has increased by 15% in Q2 2023 compared to Q1 2023, predominantly due to ‘Cracked Surface’ defects. This issue first became apparent at the beginning of Q2 and has been consistent since. Initial observations suggest it may be due to material quality or machine calibration issues.”

 RCA Problem definition Data

Step 2: Gather Data

Once you’ve clearly defined the problem, the next step is like being a detective gathering clues. You’ll need to collect all the relevant information that will help you get to the bottom of the issue. This stage is crucial because the quality of your Root Cause Analysis depends on the quality of your data. Here’s how to go about it:

Identify Data Sources

First, figure out where you can get the information you need. This could be anything from company records and employee interviews to customer surveys and machine logs. For example, if your problem is a decrease in product quality, you might look at manufacturing data, quality control reports, and customer feedback.

Types of Data to Collect

  • Quantitative Data: These are numerical data that can be measured. Examples include sales figures, production rates, and customer satisfaction scores.
  • Qualitative Data: These are descriptive data that can be observed but not measured. Examples include employee morale, customer comments, and the observable state of machinery or processes.

Timing Matters

When did the problem start? Was it gradual or sudden? Understanding the timeline can offer important insights into potential causes. Collect historical data if possible, as this will help you see trends and patterns.

Use Tools to Collect Data

Depending on your needs, various tools can help in data collection. Spreadsheets can be useful for tracking numbers and metrics. Surveys and questionnaires can capture customer or employee feedback. Advanced organizations may use specialized software for data collection and analysis.

Document Everything

Make sure to keep a record of all the data you collect. Organize the data in a way that’s easy to understand and analyze. Charts, graphs, or tables can be helpful here.

Verify Your Data

Before you move on to analyzing the data, make sure it’s accurate and reliable. Double-check your numbers, verify survey results, and confirm any observations. The last thing you want is to make important decisions based on faulty information.

Gathering data might seem like a time-consuming step, but it’s essential for a successful Root Cause Analysis. The more thorough you are at this stage, the easier it will be to identify the actual root cause of the problem later on.

Example Collected Data

Here’s a snapshot of what some of the collected data could look like:

Machine Logs (June 2023)

Date Temperature (°C) Pressure (psi) Cycle Time (s)
June 1 200 1200 60
June 15 205 1210 61
June 30 210 1220 62


RCA Example - Machine DATA


Quality Control Reports (June 2023)

Date Defect Type Count
June 1 Cracked Surface 12
June 15 Cracked Surface 20
June 30 Cracked Surface 25

Employee Interviews

  • Operators have noticed the machine making unusual noises.
  • Quality control staff report an increase in defects that look like cracks on the surface.

Step 3: Identify Possible Causes

After you’ve defined your problem and collected all the relevant data, it’s time to roll up your sleeves and dig into the “why” behind the issue. This step is like brainstorming, but more structured. You’re trying to come up with a list of all the things that could possibly be causing the problem you’ve identified. Here’s how to do it:

Choose a Method

As mentioned earlier, there are various methods you can use to identify possible causes. Two of the most common are the Fishbone Diagram and the 5 Whys. The choice depends on the nature of your problem.

  • Fishbone Diagram: This is good for complex problems where multiple factors could be at play. The diagram allows you to visually organize potential causes into different categories, making it easier to focus your investigation.
  • The 5 Whys: This method is more straightforward and works well for simpler problems. By repeatedly asking “Why?” you dig deeper into the issue until you identify possible root causes.

Involve the Right People

Don’t try to do this all on your own. Involve team members who are familiar with the problem area. They can offer valuable insights you might not have considered. If you’re dealing with a technical issue, for instance, having an engineer in the room can be incredibly helpful.

Generate a List of Possible Causes

Using your chosen method, start listing down all the potential causes. Be as comprehensive as possible. If you’re using a Fishbone Diagram, for instance, you’d list potential causes under each category or “bone” of the fish. For the 5 Whys, you’d document the chain of reasoning that leads you to potential root causes.

Use Your Data

Remember the data you collected in Step 2? Now’s the time to use it. Align your list of possible causes with the data to see which ones are most likely. For example, if one of your potential causes is “Poor Training,” but your data shows that all employees have completed mandatory training, then you might want to reconsider that cause.

Prioritize Causes

Not all causes are created equal. Some are more likely than others to be the root cause of your problem. Use your team’s expertise and the data you’ve collected to prioritize which causes to investigate further.

By the end of this step, you should have a well-organized list of possible causes for your problem, backed by data and expert input. This sets the stage for the next steps, where you’ll zero in on the actual root cause and figure out how to fix it.

Example of Identifying Possible causes

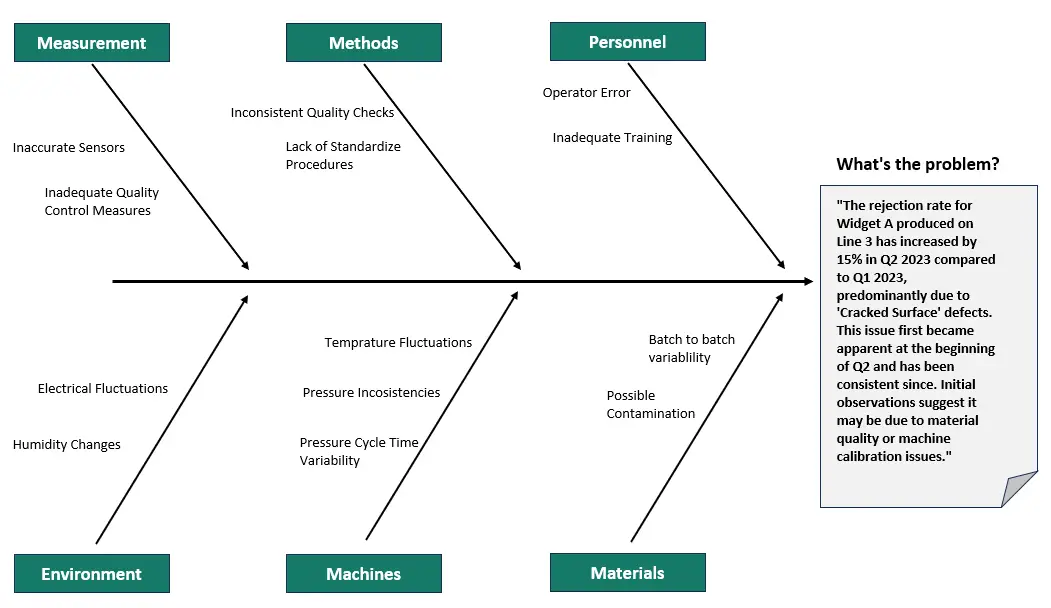
Following on with the same example, as this is a more complex issue with multiple factors, it makes sense to conduct the root cause analysis using the Fishbone method. Therefore, we need to ensure to include the right people—a cross-functional team. In this case, that would comprise production engineers who understand the machinery, quality control experts who have the data on defects, and machine operators who can provide firsthand experience and observations.

The next step is to collectively brainstorm and categorize potential causes for the increased rejection rate in Widget A. Utilizing the Fishbone Diagram, the team breaks down the problem into six major categories: Machine, Method, Material, Manpower, Environment, and Measurement.

Identifying the possible causes in our example

Following on with the same example, as this is a more complex issue with multiple factors, it makes sense to conduct the root cause analysis using the Fishbone method. Therefore, we need to ensure to include the right people—a cross-functional team. In this case, that would comprise production engineers who understand the machinery, quality control experts who have the data on defects, and machine operators who can provide firsthand experience and observations. The next step is to collectively brainstorm and categorize potential causes for the increased rejection rate in Widget A. 

Utilizing the Fishbone Diagram, the team breaks down the problem into six major categories: Machine, Method, Material, Manpower, Environment, and Measurement.

RCA Example - Fishbone analysis

Step 4: Determine the Root Cause

After identifying a list of possible causes, it’s time to put on your detective hat again and figure out which one is the real culprit—the root cause of your problem. 

Determining The Root Cause Process

This is a critical step, as identifying the wrong cause can lead you down a path of ineffective solutions. Here’s how to go about it:

Review Your List of Possible Causes

Start by revisiting the list you made in the previous step. This will serve as your “suspect list” in identifying the root cause. At this point, you’ve already done some initial prioritization, so you have an idea of which causes are most likely.

Analyze the Data

Remember the data you collected in Step 2? Now is the time to dive deep into it. Compare each possible cause against the data to see if it holds up. Look for patterns, correlations, or anomalies that might point to one cause over the others.

For example, if you’re dealing with a decrease in product quality and one of your possible causes is “Faulty Raw Materials,” you could look at inspection reports, batch numbers, and supplier records to see if there’s a correlation.

Conduct Tests or Experiments

Sometimes, analyzing existing data isn’t enough. You might need to conduct additional tests or experiments to validate or rule out possible causes. For instance, if you suspect a machine is malfunctioning and causing a problem, you might run it under controlled conditions to see if the issue repeats.

Use Logical Reasoning

Sometimes the root cause isn’t obvious, even with data and testing. In such cases, logical reasoning can help. You might use deductive reasoning to rule out unlikely causes or inductive reasoning to generalize from specific observations.

Involve Experts

If you’re stuck or the root cause isn’t clear, don’t hesitate to consult experts. These could be internal team members with specific expertise or external consultants who specialize in the problem area you’re investigating.

Confirm the Root Cause

Before you move on to finding a solution, make sure you’ve found the real root cause and not just a symptom of a deeper issue. Validate your findings by asking:

  • Does this cause explain most or all of the problem?
  • If we fix this, is it likely that the problem will be solved?
  • Do most team members agree that this is the root cause?

Once you’ve determined the root cause, document it clearly. You’ll use this information in the next step to develop and implement a solution that addresses the issue at its core, ensuring it’s less likely to recur in the future.

Determining the Root Cause of our Example

Continuing with our example, the cross-functional team now shifts its focus to determining the root cause of the increased rejection rate for Widget A. Armed with their prioritized list of possible causes and the data gathered, they delve into the next step of the RCA process.

The team begins by revisiting the “suspect list” generated using the Fishbone Diagram. Machine-related factors, particularly temperature fluctuations, pressure inconsistencies, and cycle time variability, are at the top of this list, followed by material quality concerns.

Analyze the Data

Digging deeper into the data collected, the team finds that the temperature, pressure, and cycle time increases directly correlate with the spike in the ‘Cracked Surface’ defect type. They also note that the unusual noises observed by machine operators started to occur around the same time the defects increased.

Conduct Tests or Experiments

To validate these observations, the team decides to run the molding machine under controlled conditions, varying one parameter at a time while keeping the others constant. After a series of tests, they discover that an increase in temperature directly leads to the ‘Cracked Surface’ defects in the widgets.

Use Logical Reasoning

Using deductive reasoning, the team rules out other possible causes. For instance, since all operators have completed mandatory training and the material batches show no signs of contamination, these are less likely to be the root causes.

Confirm the Root Cause

After careful consideration and validation, the team reaches a consensus that the root cause of the problem is “Temperature Fluctuations in the Molding Machine.” This conclusion satisfies the criteria for root cause identification:

  • It explains most, if not all, of the ‘Cracked Surface’ defects.
  • Fixing this issue is likely to resolve the problem.
  • Most team members agree that this is the root cause.

The team documents this root cause clearly and prepares for the next step in the RCA process: developing and implementing a solution that will fix this issue at its core, thereby preventing its recurrence in the future.

Step 5: Implement and Monitor Solutions

Congratulations, you’ve identified the root cause! But your journey doesn’t end here. The whole point of Root Cause Analysis (RCA) is to not just find the root cause but to fix it so the problem doesn’t happen again. This is where Step 5 comes in, where you implement solutions and make sure they actually work. Here’s how to go about it:

Develop a Solution Plan

The first thing you need to do is come up with a plan for how you’re going to fix the root cause you’ve identified. This should include:

  • What needs to be done: The specific actions that will address the root cause.
  • Who will do it: The people responsible for each action.
  • When it will be done: A timeline for implementation.
  • How it will be done: The resources and methods needed to implement the solution.

Gain Approval and Support

Before you start making changes, make sure you have the necessary approvals. This might mean getting a budget approved or getting buy-in from key stakeholders. The more support you have, the smoother the implementation process will be.

Implement the Solution

Now it’s time to roll up your sleeves and get to work. Follow the plan you’ve developed, and start implementing the solution. This could involve anything from retraining staff and revising procedures to repairing equipment or introducing new technology.

Monitor Effectiveness

You can’t just implement a solution and walk away. You need to monitor how well it’s working. This means going back to the data you collected in Step 2 and continuing to track those metrics. Are they showing improvement? If not, you may need to revisit your solution or even go back to earlier steps in the RCA process.

Make Adjustments as Needed

Sometimes a solution that looks great on paper doesn’t work out as well in the real world. If you find that your solution isn’t as effective as you’d hoped, be prepared to make adjustments. This could mean tweaking your current solution or going back to the drawing board to identify a different root cause.

Document the Process

Don’t forget to document everything you’ve done, from the solutions you implemented to the results you achieved. This documentation can be invaluable for future problem-solving efforts and for creating a knowledge base that can help prevent similar problems in the future.

Implementing and monitoring solutions of our example

After identifying “Temperature Fluctuations in the Molding Machine” as the root cause, the team crafts a detailed solution plan:

  • What Needs to Be Done: Overhaul the machine’s cooling system and recalibrate temperature settings.
  • Who Will Do It: A dedicated team of production engineers and machine operators.
  • When It Will Be Done: To be completed within a two-week timeframe.
  • How It Will Be Done: Allocate necessary resources like new cooling components and software for recalibration.
Task Responsible Timeline Resources Needed Status
Overhaul cooling system Production Engineers Week 1 Cooling components, tools To be started
Recalibrate temperature settings Production Engineers Week 1-2 Calibration software, tools To be started
Conduct a pilot run Machine Operators Week 2 Test materials To be started

Gain Approval and Support

Before proceeding, the team prepares a budget proposal and secures approval from management. They also consult with the quality control team and machine operators to gain their buy-in, ensuring a smoother implementation process.

Implement the Solution

The team then sets out to execute the plan. The cooling system is overhauled, and the machine is recalibrated. A pilot run is conducted to ensure that the new settings are effective in maintaining consistent temperature levels.

Monitor Effectiveness

After implementing the changes, the team goes back to the data. They continue to monitor the same metrics—temperature, pressure, cycle time, and defect count. Initial results show a significant reduction in the ‘Cracked Surface’ defect type. The temperature fluctuations have notably decreased.

RCA Example Post improvement

Make Adjustments as Needed

While the initial results are promising, the team remains vigilant. They agree to meet bi-weekly to review the data and make any necessary adjustments to the solution. So far, no further modifications are required.

Document the Process

The entire RCA process, from problem identification to solution implementation and monitoring, is meticulously documented. This documentation will serve as a valuable resource for future troubleshooting and continuous improvement initiatives.

By diligently following this five-step RCA process, the team has not only identified the root cause of the problem but has also successfully implemented a solution to prevent its recurrence.

Conclusion

RCA is more than just a problem-solving method; it’s a strategic approach that dives deep into issues to eliminate them at their source. By following the Five-Step RCA Process, organizations can not only identify the real culprits behind their problems but also develop and implement long-lasting solutions. This guide walked you through each step in detail, from defining the problem to monitoring the effectiveness of your solutions. Remember, the quality of your RCA is as good as the effort and attention to detail you put into it. Whether you’re looking to improve product quality, enhance customer satisfaction, or increase cost-efficiency, a well-executed RCA can be a game-changing tool in your continuous improvement arsenal. It’s not just about fixing what’s broken; it’s about building something better for the long term.

References

A: Identifying and resolving the root cause of an issue is crucial for achieving sustainable improvements. Focusing only on symptoms can lead to temporary fixes that may mask the underlying problem. RCA helps you understand the systemic issues contributing to a problem, allowing you to put in place measures that result in lasting change.

A: Several methods are commonly used for Root Cause Analysis, including:

  1. 5 Whys: A simple technique that involves asking “why” multiple times until the root cause is identified.
  2. Fishbone Diagram (Ishikawa Diagram): A visual tool used to categorize potential causes of a problem.
  3. Fault Tree Analysis: A graphical representation of various probable causes of an issue, arranged in a hierarchical manner.
  4. Pareto Analysis: Identifying the most significant factors contributing to a problem based on the Pareto principle.
  5. FMEA (Failure Modes and Effects Analysis): A structured approach to identifying potential failure modes and their consequences.

A: Initiating a Root Cause Analysis typically involves the following steps:

  1. Define the Problem: Clearly articulate what the issue is.
  2. Collect Data: Gather relevant information and evidence.
  3. Identify Possible Causes: List potential causes that could be contributing to the problem.
  4. Analyze: Use RCA methods like the 5 Whys or Fishbone Diagram to dig deeper.
  5. Identify Root Cause(s): Through analysis, pinpoint the underlying cause(s).
  6. Develop and Implement Solutions: Create action plans to address the root cause(s).
  7. Review: Evaluate the effectiveness of the solutions and make adjustments as needed.

A: Absolutely, Root Cause Analysis is a versatile tool that can be applied in various sectors, including healthcare, IT, logistics, and even the public sector. The principles remain the same: identify the root cause to implement effective, long-term solutions.

A: Some common pitfalls to be aware of include:

  1. Rushing the Process: Skipping steps or rushing through them can lead to incorrect conclusions.
  2. Blaming Individuals: RCA should focus on systemic issues rather than blaming individual employees.
  3. Ignoring Data: Failing to consult data can result in assumptions that may not be accurate.
  4. Lack of Follow-Up: Without proper evaluation and adjustment, even good solutions may fail over time.

Author

Picture of Daniel Croft

Daniel Croft

Hi im Daniel continuous improvement manager with a Black Belt in Lean Six Sigma and over 10 years of real-world experience across a range sectors, I have a passion for optimizing processes and creating a culture of efficiency. I wanted to create Learn Lean Siigma to be a platform dedicated to Lean Six Sigma and process improvement insights and provide all the guides, tools, techniques and templates I looked for in one place as someone new to the world of Lean Six Sigma and Continuous improvement.

All Posts

Guides

Was this helpful?

Thanks for your feedback!