What is a Visual Management

Guide: Visual Management

Author's Avatar

Daniel Croft

Daniel Croft is an experienced continuous improvement manager with a Lean Six Sigma Black Belt and a Bachelor's degree in Business Management. With more than ten years of experience applying his skills across various industries, Daniel specializes in optimizing processes and improving efficiency. His approach combines practical experience with a deep understanding of business fundamentals to drive meaningful change.

Visual Management is key in lean management and continuous improvement methodologies. It leverages visual methods to communicate information in a manner that is clear, quick, and universally accessible. Rooted in the idea that visual cues are processed faster and more effectively than text-based data, it encompasses various techniques like color-coded charts for immediate comprehension.

This approach is integral in environments where rapid information processing and decision-making are essential. From Kanban boards that highlight workflow efficiencies to Andon systems signaling operational status, visual management is diverse, embracing tools like 5S methodologies and performance dashboards to enhance workplace efficiency and clarity.

Table of Contents

What is Visual Management?

Visual Management is one of the key tools used in lean management and continuous improvement methodologies. It is a system that uses visual methods to communicate information clearly, quickly, and effectively.

It is based on the fundamental concept that visual information is processed faster, is more accessible, and is language-independent compared to text-based information. For example, a quick glance at a color-coded chart can explain instantly what a paragraph of text might take to explain. 

Audit visual management

For example the 5S Audit sheet below, with the line graph of a color-coded background we know green is good and red is bad. Therefore, we can see the trend of 5S audits in the area is generally good.

Similarly, if we look are PPE (Personal Protective Signs), it is easy to identify what PPE is needed in the area at a glance. This approach is especially useful in situations where quick information processing and decision making is vital.

Types of Visual Management

Within Lean Manufacturing many different types of Visual Management can be used such as:

Kanban Boards:

Kanban boards are a form of visual management; they are especially popular in Agile and Lean methodologies. Kanban boards help in visualising work, limiting work-in-progress and maximizing efficiency. By using Kanban boards, you can instantly see how much work is in progress and how much work is at one particular process step, highlighting any process bottlenecks. This can be a good first step to implementing visual management in the workplace.

Kanban_board-elements

You can read our full guide on Kanban boards by clicking here.

Andon Systems:

The next type of visual management you might find in the workplace is Andon systems. These systems are critical in most large manufacturing environments, but you will also find them in other businesses, such as supermarket shopping tills, to tell shoppers whether a checkout is open or closed.

AndonSystem

In manufacturing, these light systems are often used on production lines or machinery. To indicate quickly and visually the status of the machine, such as:

  • Red: Production has Stopped
  • Amber: Problem Identified
  • Green: Production is Normal

This is a very useful method in large production environments with many pieces of equipment to signal which areas need engineering or maintenance attention rather than having to explain or direct someone to the machine with an issue. Additionally, these systems can often be triggered automatically based on machine sensors.

You can read our full guide on Andon by clicking here.

5S Methodology:

the 5S Cycle, Sort, Set in order, Shine, Standardise, Sustain

5S is another method that originated in Japan which stands for: Sort, Set in order, Shine, Standardize and Sustain. 5S is formed based on visual management to organize the workplace.

With 5S you might see visual management take place with the following methods:

  • Floor markings: different colors to signify different meanings
  • Shadow boards: for tooling and equipment
  • Signage and labelling: To detail or signal equipment use
  • Red Tags: To signal, an item may not be needed.
  • 5S Audit Sheets and Score Cards: To show the current 5S standard for the area.

You can read our full guide on 5S by clicking here.

Performance Dashboards:

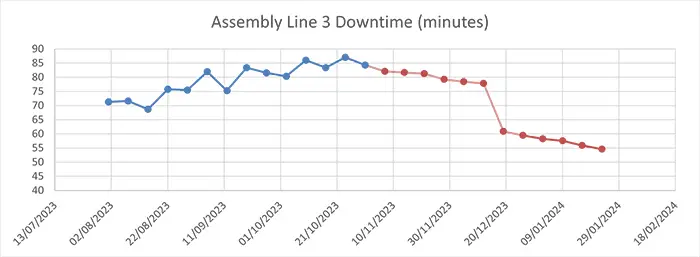
Performance dashboards are used extensively in various industries to provide a visual representation of key performance indicators (KPIs) and other critical data. Being able to understand data visually is very useful, especially if you need to understand what an issue is, such as with Control Charts. With charts, you can see when an issue started, uptrends, downtrends, outliers, etc. 

A3 Structured Problem Solving - Step 5 - Confirmation Chart

Implementing Visual Management

Step 1: Assessing Your Needs

Before implementing visual management in your business, you should assess the unique challenge and the need for visual management to ensure you select the right methods to solve the problems. This involves an analysis of the current processes and identifying areas that are lacking efficiency and effectiveness.

Determine the business areas where visual management could have the most impact. This might include areas with complex workflows, high defect and error rates, regular communication issues, or where performance could be improved through transparency.

In addition to this, it is important to engage the stakeholders of the business and key processes in the assessment process. This does not just include management but also those operators who work the processes, as they have the most insight into the day-to-day challenges in the business.

Step 2: Choosing the Right Tools

Based on your assessment in the first step and understanding the challenges that visual management can solve, you should select the visual management technique that is most suited. Visual management is not a one-size-fits-all process, and all visual management should be uniquely implemented to suit the needs of the business, the process, and the people working in the area. However, it should still be universally understandable and not require explanation. 

Examples of Tool Selection:

  • For Workflow Management: Kanban boards are excellent for visualizing task progress and identifying bottlenecks in workflows.
  • For Quality Control: Tools like Andon systems for real-time alerts or color-coded systems for immediate issue identification can be effective.
  • For Performance Monitoring: Performance dashboards with real-time metrics can be beneficial to keep track of KPIs.

To implement any of these methods, look at our implementation guides.

Customize these tools to fit the specific context of your organization. For instance, the layout of a Kanban board might differ significantly between a software development team and a manufacturing plant.

Step 3: Training and Culture

Implementing any of these visual management methods is just the start and will require training and time for the new way of working to become part of the culture. Visual management, like continuous improvement, is a continuous process that never ends, the first implementation of visual management will not be the end state, it will be the first step of continually improving and increasing efficiency.

All of this will need to be supported with training and working with stakeholders to ensure they understand not only what it is, how it works, and what the benefits are. Also, what to do in the event there is an issue, such as tools missing from the shadow board, will depend on how they can maintain it and take ownership.

Conclusion

Implementing Visual Management is a strategic process that transforms the efficiency and effectiveness of an organization. It begins with a thorough assessment of specific needs, leading to the selection of suitable visual tools tailored to address distinct challenges, whether in workflow management, quality control, or performance tracking.

Customization and relevance are key, ensuring these tools are universally understandable yet specific to the context they are applied in. However, the true power of visual management lies beyond its implementation. It requires fostering a culture that embraces continuous improvement, supported by training and stakeholder engagement. This continuous process, when integrated into the organizational fabric, not only streamlines operations but also cultivates an environment of transparency, efficiency, and progressive change.

References

Visual management is a method of communicating information, improving understanding, and improving decision-making within an organization by using visual cues such as charts, diagrams, and indicators.

Improving communication, streamlining processes, increasing productivity, improving safety, reducing waste, and improving overall operational efficiency are all advantages of implementing Visual Management.

Visual management can be used in a variety of industries, including manufacturing, healthcare, construction, logistics, and service. It is adaptable to various processes and can be tailored to the unique needs and requirements of each industry.

Graphs and charts (e.g., bar graphs, line charts), Kanban boards, visual indicators (e.g., color-coded signs, labels), and floor markings are common visual tools used in Visual Management.

It is critical to keep visual displays for Visual Management simple, to use clear labels and captions, and to standardize visual cues. Concentrate on conveying the most important information in a visually appealing and easily understandable format.

Visual displays should be reviewed and updated on a regular basis to ensure that they remain relevant and aligned with changing needs and circumstances. The frequency of updates will be determined by the specific processes and the organization’s rate of change.

Employee engagement is essential in Visual Management because it fosters ownership, participation, and continuous improvement. Employee involvement in the design and improvement process improves their understanding, commitment, and contribution to the Visual Management system’s success.

Author

Picture of Daniel Croft

Daniel Croft

Daniel Croft is a seasoned continuous improvement manager with a Black Belt in Lean Six Sigma. With over 10 years of real-world application experience across diverse sectors, Daniel has a passion for optimizing processes and fostering a culture of efficiency. He's not just a practitioner but also an avid learner, constantly seeking to expand his knowledge. Outside of his professional life, Daniel has a keen Investing, statistics and knowledge-sharing, which led him to create the website learnleansigma.com, a platform dedicated to Lean Six Sigma and process improvement insights.

All Posts

Free Lean Six Sigma Templates

Improve your Lean Six Sigma projects with our free templates. They're designed to make implementation and management easier, helping you achieve better results.

Other Guides