

Author: Daniel Croft
Daniel Croft is an experienced continuous improvement manager with a Lean Six Sigma Black Belt and a Bachelor's degree in Business Management. With more than ten years of experience applying his skills across various industries, Daniel specializes in optimizing processes and improving efficiency. His approach combines practical experience with a deep understanding of business fundamentals to drive meaningful change.
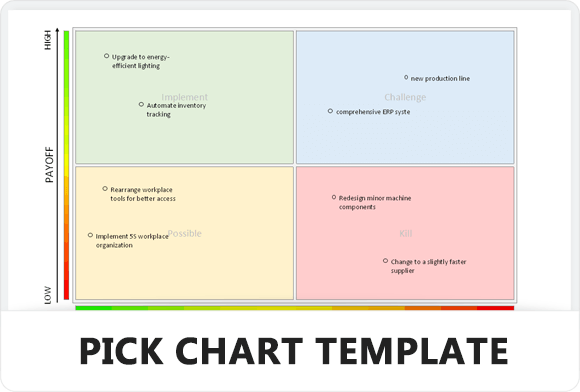
A PICK Chart is a useful tool for business management and decision-making, designed to streamline the complex process of sorting and prioritizing a multitude of ideas, tasks, or projects. This tool, which stands for Possible, Implement, Challenge, and Kill, employs a visual representation to distil decision-making into a more manageable form, especially in scenarios brimming with diverse ideas.
Its effectiveness lies in its simplicity and structured approach, categorizing ideas into four distinct quadrants based on two critical parameters: the ease of implementation and the potential impact. This methodology not only aids in swift decision-making but also ensures that the process is strategic and data-driven.
A PICK chart is a useful tool used for sorting and prioritizing ideas, tasks or projects. At its core, this tool is a visual representation, simplifying the complex decision-making process in scenarios where ideas abound, and efficiency is key. The acronym PICK – Possible, Implement, Challenge, and Kill – concisely captures the importance of this methodology.
Brainstorming sessions create a plethora of ideas, the 
Ideas that fall into the ‘Possible’ quadrant are characterized by their relative ease of implementation yet minimal impact. This does not render them unimportant but indicates that their immediate effect might not be transformative. They are typically low-hanging fruits – initiatives that can be achieved with little effort but don’t dramatically change the status quo. These ideas are often earmarked for later consideration, especially when resources are scarce or when more impactful initiatives take precedence. There’s also an opportunity to refine these ideas, enhancing their potential impact or aligning them more closely with strategic objectives.
The ‘Implement’ quadrant is reserved for those rare gems that are both easy to execute and promise significant returns or impact. These are the ideas that teams dream of – initiatives that can be quickly rolled out without extensive resources yet have the power to make a substantial difference. These ideas are usually prioritized and actioned swiftly. They represent quick wins, boosting morale and demonstrating visible progress. In many cases, these initiatives can serve as stepping stones to more complex projects, building a foundation of success and learning.
High-impact, high-difficulty ideas land in the ‘Challenge’ quadrant. These are the ambitious, game-changing initiatives that can potentially redefine an organization’s trajectory. However, their complexity or resource demands make them challenging to implement. They require careful planning, substantial resources, and often, a longer timeframe. Organizations might approach these ideas with a phased strategy, breaking down the larger project into smaller, more manageable parts. Despite their demanding nature, these initiatives can be the most rewarding, offering significant competitive advantages or breakthrough improvements.
Finally, the ‘Kill’ quadrant is where ideas that are both difficult to implement and have low impact reside. These ideas are typically sidelined, as they do not justify the investment of resources. However, labeling an idea as ‘Kill’ doesn’t always mean it is forever discarded. It could be revisited in the future, especially if circumstances change, such as advancements in technology or shifts in market dynamics. The ‘Kill’ quadrant serves as a necessary filter, ensuring that effort and resources are not squandered on initiatives that offer little in return.
The process of using a PICK chart is similar to any other matrix like an impact and effort. However, if you are not sure, follow the steps below

The preparation phase is foundational in creating an effective PICK Chart. Start by assembling a diverse team. Diversity here pertains not just to professional backgrounds but also to perspectives, skills, and experience levels. A multifaceted team brings a broader range of insights, making the brainstorming process more comprehensive and inclusive.
Next, establish a clear understanding of the project’s goals and constraints. Goals provide direction, ensuring that the ideas generated align with the broader objectives of the organization or project. Constraints, on the other hand, could include budget limits, timeframes, resource availability, or specific industry regulations. Having a clear picture of these parameters ensures that the brainstorming session stays grounded in reality, and the ideas generated are feasible within the given context.

Drawing the PICK Chart is the next step. Create a two-dimensional chart with ‘Ease of Implementation’ on the x-axis and ‘Impact’ on the y-axis. This creates four quadrants. The horizontal axis (Ease of Implementation) ranges from easy on the left to hard on the right. The vertical axis (Impact) ranges from low at the bottom to high at the top.

Label the quadrants as follows:
This visual framework is crucial as it provides a clear and simple way to categorize and evaluate ideas.
Now, evaluate each idea based on its ease of implementation and potential impact. This step requires careful consideration and often benefits from team discussion. Factors to consider include required resources, expertise, time, and potential return on investment. Place each idea in the appropriate quadrant of the PICK Chart. It’s important to approach this step with an open mind, as different team members may have varying perspectives on the feasibility and impact of each idea.
With all ideas placed on the chart, facilitate a discussion around each one. This is where the diverse perspectives of the team become invaluable. Discuss the merits, challenges, and potential of each idea. Consider resources, timeframes, and alignment with strategic objectives. Some ideas may move between quadrants during this discussion as their merits are debated and understood more fully.
Finally, make decisions on which ideas to pursue, which to modify, and which to discard or put on hold. This decision-making should be consensus-driven, as far as possible, to ensure buy-in from all team members.

Broader Perspective: Different departments view challenges and solutions through distinct lenses. For instance, what might seem feasible to a technical team may be seen as commercially unviable by the sales team. Combining these perspectives leads to a more holistic evaluation of ideas.
Enhanced Creativity: Diverse teams tend to be more creative. The cross-pollination of ideas from different fields can lead to innovative solutions that a homogenous group might overlook.
Increased Buy-in: When people from various parts of the organization contribute to the decision-making process, there is a greater sense of ownership and buy-in for the selected projects. This can be crucial for successful implementation.
Flexibility in the use of a PICK Chart is key. The business environment is dynamic, and what might seem unfeasible today could become viable tomorrow due to changes in technology, market conditions, or internal capabilities. Therefore:
Reassess Regularly: Ideas initially placed in the ‘Kill’ quadrant should be revisited periodically. This reassessment ensures that no potentially valuable idea is permanently discarded due to temporary constraints.
Adapt to Change: Be willing to move ideas between quadrants as new information emerges or as circumstances evolve. This adaptability ensures that the organization’s strategy remains responsive and relevant.
The PICK Chart is not a one-time tool but a dynamic part of the strategic planning process. Regular reviews are essential:
Stay Aligned with Goals: As organizational goals and strategies evolve, so too should the prioritization of ideas. Regular reviews ensure that the initiatives align with the current strategic direction.
Respond to External Changes: Market trends, economic conditions, and competitive landscapes are always in flux. Regularly updating the PICK Chart in response to these changes ensures that the organization remains agile and competitive.
Maintaining a record of all the ideas and their categorizations is crucial for several reasons:
Track Progress: Documentation allows for tracking the progress of ideas from conception through to implementation. This tracking is valuable for measuring success and learning from past initiatives.
Historical Reference: Keeping a record of past ideas can be a valuable resource for future brainstorming sessions. It provides insights into past thinking patterns and decisions.
Accountability: Documentation creates a sense of accountability for the decisions made. It helps in understanding why certain ideas were prioritized over others, providing clarity and transparency.

In conclusion, the PICK Chart is a powerful tool for navigating the often overwhelming landscape of ideas and projects in a business setting. By categorizing ideas into Possible, Implement, Challenge, and Kill, it offers a structured and strategic framework for decision-making.
The chart’s effectiveness is significantly amplified through collaborative efforts, flexibility in approach, regular reviews, and meticulous documentation. It facilitates an environment where decision-making is not just intuitive but also aligns with the evolving needs and goals of the organization, ensuring that resources are allocated to initiatives that promise the most significant impact and return.
A: A PICK Chart is a simple yet effective tool used in business management to categorize and prioritize ideas, tasks, or projects. It’s a visual method of decision-making where ideas are placed into one of four quadrants labeled as Possible, Implement, Challenge, and Kill, based on their ease of implementation and potential impact.
A: The placement of an idea in a specific quadrant depends on two factors: its ease of implementation and its potential impact. If an idea is easy to implement and has a high impact, it goes into the Implement quadrant. Ideas that are easy but have low impact are labeled as Possible. High-impact but difficult-to-implement ideas fall into the Challenge quadrant, while ideas that are both hard to implement and have low impact are placed in the Kill quadrant.
A: Yes, ideas can shift between quadrants as circumstances change. For example, an idea initially in the Kill quadrant might become more feasible due to technological advancements or changes in market conditions, thus moving to a different quadrant. Regular review and reassessment of the ideas on the PICK Chart are essential to reflect such changes.
A: A diverse group of team members from different departments or areas of expertise should be involved in creating and reviewing a PICK Chart. This diversity ensures a broad range of perspectives, leading to more comprehensive evaluations of ideas. It also helps in gaining wider acceptance and buy-in for the decisions made.
A: A PICK Chart aids in strategic decision-making by providing a clear and structured way to evaluate a large number of ideas. It helps in identifying which ideas should be prioritized for implementation, which need further development, and which should be discarded or postponed. This methodical approach ensures that resources are allocated efficiently and efforts are focused on initiatives that align with the organization’s strategic goals and have the potential for the greatest impact.

Daniel Croft is a seasoned continuous improvement manager with a Black Belt in Lean Six Sigma. With over 10 years of real-world application experience across diverse sectors, Daniel has a passion for optimizing processes and fostering a culture of efficiency. He's not just a practitioner but also an avid learner, constantly seeking to expand his knowledge. Outside of his professional life, Daniel has a keen Investing, statistics and knowledge-sharing, which led him to create the website www.learnleansigma.com, a platform dedicated to Lean Six Sigma and process improvement insights.

Improve your Lean Six Sigma projects with our free templates. They're designed to make implementation and management easier, helping you achieve better results.