

Author: Daniel Croft
Daniel Croft is an experienced continuous improvement manager with a Lean Six Sigma Black Belt and a Bachelor's degree in Business Management. With more than ten years of experience applying his skills across various industries, Daniel specializes in optimizing processes and improving efficiency. His approach combines practical experience with a deep understanding of business fundamentals to drive meaningful change.
In the world of data-driven decision-making, Hypothesis Testing stands as a cornerstone methodology. It serves as the statistical backbone for a multitude of sectors, from manufacturing and logistics to healthcare and finance. But what exactly is Hypothesis Testing, and why is it so indispensable? Simply put, it’s a technique that allows you to validate or invalidate claims about a population based on sample data. Whether you’re looking to streamline a manufacturing process, optimize logistics, or improve customer satisfaction, Hypothesis Testing offers a structured approach to reach conclusive, data-supported decisions.
The graphical example above provides a simplified snapshot of a hypothesis test. The bell curve represents a normal distribution, the green area is where you’d accept the null hypothesis (H0), and the red area is the “rejection zone,” where you’d favor the alternative hypothesis (Ha). The vertical blue line represents the threshold value or “critical value,” beyond which you’d reject H0.

Here’s a graphical example of a hypothesis test, which you can include in the introduction section of your guide. In this graph:
This graphical representation serves as a conceptual foundation for understanding the mechanics of hypothesis testing. It visually illustrates what it means to accept or reject a hypothesis based on a predefined level of significance.
Hypothesis testing is a structured procedure in statistics used for drawing conclusions about a larger population based on a subset of that population, known as a sample. The method is widely used across different industries and sectors for a variety of purposes. Below, we’ll dissect the key components of hypothesis testing to provide a more in-depth understanding.
In every hypothesis test, there are two competing statements:
Before conducting the test, you decide on a “Significance Level” (α), typically set at 0.05 or 5%. This level represents the probability of rejecting the null hypothesis when it is actually true. Lower α values make the test more stringent, reducing the chances of a ‘false positive’.
You then proceed to gather data, which is usually a sample from a larger population. The quality of your test heavily relies on how well this sample represents the population. The data can be collected through various means such as surveys, observations, or experiments.
Depending on the nature of the data and what you’re trying to prove, different statistical tests can be applied (e.g., t-test, chi-square test, ANOVA, etc.). These tests will compute a test statistic (e.g., t, 2χ2, F, etc.) based on your sample data.
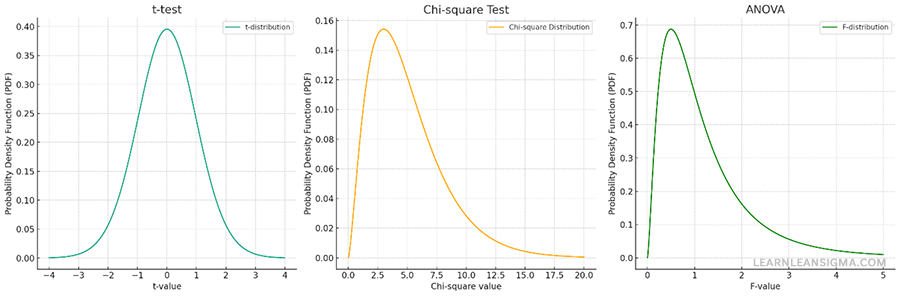
Here are graphical examples of the distributions commonly used in three different types of statistical tests: t-test, Chi-square test, and ANOVA (Analysis of Variance), displayed side by side for comparison.
T-Test
Chi-square Test
ANOVA (F-distribution)
These visual representations provide an intuitive understanding of the different statistical tests and their underlying distributions. Knowing which test to use and when is crucial for conducting accurate and meaningful hypothesis tests.
The test statistic is then compared to a critical value determined by the significance level (α) and the sample size. This comparison will give you a p-value. If the p-value is less than α, you reject the null hypothesis in favor of the alternative hypothesis. Otherwise, you fail to reject the null hypothesis.
Finally, you interpret the results in the context of what you were investigating. Rejecting the null hypothesis might mean implementing a new process or strategy, while failing to reject it might lead to a continuation of current practices.
To sum it up, hypothesis testing is not just a set of formulas but a methodical approach to problem-solving and decision-making based on data. It’s a crucial tool for anyone interested in deriving meaningful insights from data to make informed decisions.
Hypothesis testing is a cornerstone of statistical and empirical research, serving multiple functions in various fields. Let’s delve into each of the key areas where hypothesis testing holds significant importance:
In today’s complex business environment, making decisions based on gut feeling or intuition is not enough; you need data to back up your choices. Hypothesis testing serves as a rigorous methodology for making decisions based on data. By setting up a null hypothesis and an alternative hypothesis, you can use statistical methods to determine which is more likely to be true given a data sample. This structured approach eliminates guesswork and adds empirical weight to your decisions, thereby increasing their credibility and effectiveness.
Hypothesis testing allows you to assign a ‘p-value’ to your findings, which is essentially the probability of observing the given sample data if the null hypothesis is true. This p-value can be directly used to quantify risk. For instance, a p-value of 0.05 implies there’s a 5% risk of rejecting the null hypothesis when it’s actually true. This is invaluable in scenarios like product launches or changes in operational processes, where understanding the risk involved can be as crucial as the decision itself.
Here’s an example to help you understand the concept better.
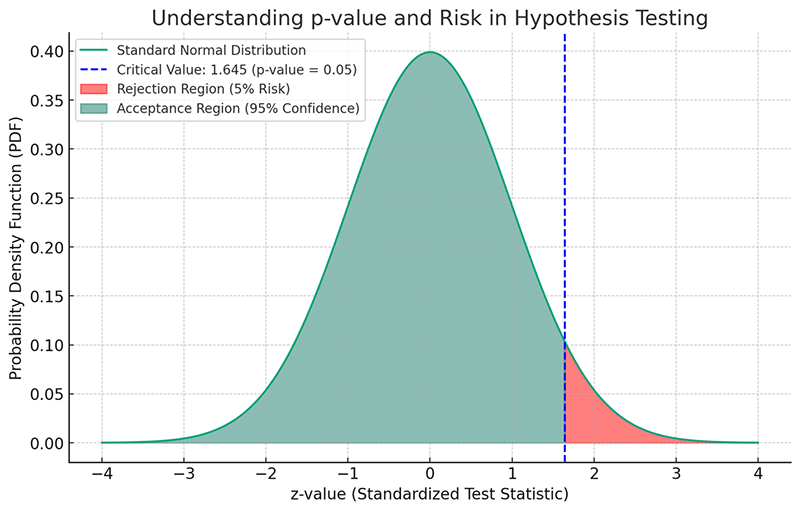
The graph above serves as a graphical representation to help explain the concept of a ‘p-value’ and its role in quantifying risk in hypothesis testing. Here’s how to interpret the graph:
Elements of the Graph
The p-value can be directly related to risk management. For example, if you’re considering implementing a new manufacturing process, the p-value quantifies the risk of that decision. A low p-value (less than α) would mean that the risk of rejecting the null hypothesis (i.e., going ahead with the new process) when it’s actually true is low, thus indicating a lower risk in implementing the change.
In sectors like manufacturing, automotive, and logistics, maintaining a high level of quality is not just an option but a necessity. Hypothesis testing is often employed in quality assurance and control processes to test whether a certain process or product conforms to standards. For example, if a car manufacturing line claims its error rate is below 5%, hypothesis testing can confirm or disprove this claim based on a sample of products. This ensures that quality is not compromised and that stakeholders can trust the end product.
Resource allocation is a significant challenge for any organization. Hypothesis testing can be a valuable tool in determining where resources will be most effectively utilized. For instance, in a manufacturing setting, you might want to test whether a new piece of machinery significantly increases production speed. A hypothesis test could provide the statistical evidence needed to decide whether investing in more of such machinery would be a wise use of resources.
In the realm of research and development, hypothesis testing can be a game-changer. When developing a new product or process, you’ll likely have various theories or hypotheses. Hypothesis testing allows you to systematically test these, filtering out the less likely options and focusing on the most promising ones. This not only speeds up the innovation process but also makes it more cost-effective by reducing the likelihood of investing in ideas that are statistically unlikely to be successful.
In summary, hypothesis testing is a versatile tool that adds rigor, reduces risk, and enhances the decision-making and innovation processes across various sectors and functions.
This graphical representation makes it easier to grasp how the p-value is used to quantify the risk involved in making a decision based on a hypothesis test.

To make this guide practical and helpful if you are new learning about the concept we will explain each step of the process and follow it up with an example of the method being applied to a manufacturing line, and you want to test if a new process reduces the average time it takes to assemble a product.
The first and foremost step in hypothesis testing is to clearly define your hypotheses. This sets the stage for your entire test and guides the subsequent steps, from data collection to decision-making. At this stage, you formulate two competing hypotheses:
The null hypothesis is a statement that there is no effect or no difference, and it serves as the hypothesis that you are trying to test against. It’s the default assumption that any kind of effect or difference you suspect is not real, and is due to chance. Formulating a clear null hypothesis is crucial, as your statistical tests will be aimed at challenging this hypothesis.
Example:
In a manufacturing context, if you’re testing whether a new assembly line process has reduced the time it takes to produce an item, your null hypothesis (H0) could be:
H0:”The new process does not reduce the average assembly time.”
The alternative hypothesis is what you want to prove. It is a statement that there is an effect or difference. This hypothesis is considered only after you find enough evidence against the null hypothesis.
Example:
Continuing with the manufacturing example, the alternative hypothesis (Ha) could be:
Ha:”The new process reduces the average assembly time.”
Depending on what exactly you are trying to prove, the alternative hypothesis can be:

You are a continuous improvement manager at a car manufacturing plant. One of the assembly lines has been struggling with longer assembly times, affecting the overall production schedule. A new assembly process has been proposed, promising to reduce the assembly time per car. Before rolling it out on the entire line, you decide to conduct a hypothesis test to see if the new process actually makes a difference.
Null Hypothesis (H0)
In this context, the null hypothesis would be the status quo, asserting that the new assembly process doesn’t reduce the assembly time per car. Mathematically, you could state it as:
H0:The average assembly time per car with the new process ≥ The average assembly time per car with the old process.
Or simply:
H0:”The new process does not reduce the average assembly time per car.”
Alternative Hypothesis (Ha or H1)
The alternative hypothesis is what you aim to prove — that the new process is more efficient. Mathematically, it could be stated as:
Ha:The average assembly time per car with the new process < The average assembly time per car with the old process
Or simply:
Ha:”The new process reduces the average assembly time per car.”
Types of Alternative Hypothesis
In this example, you’re only interested in knowing if the new process reduces the time, making it a One-Sided Alternative Hypothesis.
Once you’ve clearly stated your null and alternative hypotheses, the next step is to decide on the significance level, often denoted by α. The significance level is a threshold below which the null hypothesis will be rejected. It quantifies the level of risk you’re willing to accept when making a decision based on the hypothesis test.
The significance level, usually expressed as a percentage, represents the probability of rejecting the null hypothesis when it is actually true. Common choices for α are 0.05, 0.01, and 0.10, representing 5%, 1%, and 10% levels of significance, respectively.
Example:
Continuing with the manufacturing example, let’s say you decide to set α=0.05, meaning you’re willing to take a 5% risk of concluding that the new process is effective when it might not be.
Choosing the right significance level depends on the context and the consequences of making a wrong decision. Here are some factors to consider:
By the end of Step 2, you should have a well-defined significance level that will guide the rest of your hypothesis testing process. This level serves as the cut-off for determining whether the observed effect or difference in your sample is statistically significant or not.
After formulating the hypotheses, the next step is to set the significance level (α) that will be used to interpret the results of the hypothesis test. This is a critical decision as it quantifies the level of risk you’re willing to accept when making a conclusion based on the test.
Setting the Significance Level
Given that assembly time is a critical factor affecting the production schedule, and ultimately, the company’s bottom line, you decide to be fairly stringent in your test. You opt for a commonly used significance level:
α=0.05
This means you are willing to accept a 5% chance of rejecting the null hypothesis when it is actually true. In practical terms, if you find that the p-value of the test is less than 0.05, you will conclude that the new process significantly reduces assembly time and consider implementing it across the entire line.
Why α = 0.05?
- Industry Standard: A 5% significance level is widely accepted in many industries, including manufacturing, for hypothesis testing.
- Risk Management: By setting α = 0.05, you’re limiting the risk of concluding that the new process is effective when it may not be to just 5%.
- Balanced Approach: This level offers a balance between being too lenient (e.g., α=0.10) and too stringent (e.g., α=0.01), making it a reasonable choice for this scenario.
After stating your hypotheses and setting the significance level, the next vital step is data collection. The data you collect serves as the basis for your hypothesis test, so it’s essential to gather accurate and relevant data.
Depending on your hypothesis, you’ll need to collect either:
Various methods can be used to collect data, such as:
The sample size (n) is another crucial factor. A larger sample size generally gives more accurate results, but it’s often constrained by resources like time and money. The choice of sample size might also depend on the statistical test you plan to use.
Example:
Continuing with the manufacturing example, suppose you decide to collect data on the assembly time of 30 randomly chosen products, 15 made using the old process and 15 made using the new process. Here, your sample size n=30.
Once data is collected, it often needs to be cleaned and prepared for analysis. This could involve:
By the end of Step 3, you should have a dataset that is ready for statistical analysis. This dataset should be representative of the population you’re interested in and prepared in a way that makes it suitable for hypothesis testing.
With the hypotheses stated and the significance level set, you’re now ready to collect the data that will serve as the foundation for your hypothesis test. Given that you’re testing a change in a manufacturing process, the data will most likely be quantitative, representing the assembly time of cars produced on the line.
Data Collection Plan
You decide to use a Random Sampling Method for your data collection. For two weeks, assembly times for randomly selected cars will be recorded: one week using the old process and another week using the new process. Your aim is to collect data for 40 cars from each process, giving you a sample size (n) of 80 cars in total.
Types of Data
- Quantitative Data: In this case, you’re collecting numerical data representing the assembly time in minutes for each car.
Data Preparation
- Data Cleaning: Once the data is collected, you’ll need to inspect it for any anomalies or outliers that could skew your results. For example, if a significant machine breakdown happened during one of the weeks, you may need to adjust your data or collect more.
- Data Transformation: Given that you’re dealing with time, you may not need to transform your data, but it’s something to consider, depending on the statistical test you plan to use.
- Data Coding: Since you’re dealing with quantitative data in this scenario, coding is likely unnecessary unless you’re planning to categorize assembly times into bins (e.g., ‘fast’, ‘medium’, ‘slow’) for some reason.
Example Data Points:
Car_ID Process_Type Assembly_Time_Minutes 1 Old 38.53 2 Old 35.80 3 Old 36.96 4 Old 39.48 5 Old 38.74 6 Old 33.05 7 Old 36.90 8 Old 34.70 9 Old 34.79 … … … The complete dataset would contain 80 rows: 40 for the old process and 40 for the new process.
After you have your hypotheses, significance level, and collected data, the next step is to actually perform the statistical test. This step involves calculations that will lead to a test statistic, which you’ll then use to make your decision regarding the null hypothesis.
The first task is to decide which statistical test to use. The choice depends on several factors:
For instance, you might choose a t-test for comparing means of two groups when you have a small sample size. Chi-square tests are often used for categorical data, and ANOVA is used for comparing means across more than two groups.
Once you’ve chosen the appropriate statistical test, the next step is to calculate the test statistic. This involves using the sample data in a specific formula for the chosen test.
Example:
In our manufacturing example, let’s say you’ve chosen to use a t-test to compare the average assembly time between the old and new processes. You would calculate the t-statistic using the formula:
After calculating the test statistic, the next step is to find the p-value associated with it. The p-value represents the probability of observing the given test statistic if the null hypothesis is true.
You now compare the p-value to the predetermined significance level (α):
Example:
In the manufacturing case, if your calculated p-value is 0.03 and your α is 0.05, you would reject the null hypothesis, concluding that the new process effectively reduces the average assembly time.
By the end of Step 4, you will have either rejected or failed to reject the null hypothesis, providing a statistical basis for your decision-making process.
Now that you have collected and prepared your data, the next step is to conduct the actual statistical test to evaluate the null and alternative hypotheses. In this case, you’ll be comparing the mean assembly times between cars produced using the old and new processes to determine if the new process is statistically significantly faster.
Choosing the Right Test
Given that you have two sets of independent samples (old process and new process), a Two-sample t-test for Equality of Means seems appropriate for comparing the average assembly times.
Preparing Data for Minitab
Firstly, you would prepare your data in an Excel sheet or CSV file with one column for the assembly times using the old process and another column for the assembly times using the new process. Import this file into Minitab.
Steps to Perform the Two-sample t-test in Minitab
- Open Minitab: Launch the Minitab software on your computer.
- Import Data: Navigate to
File>Openand import your data file.- Navigate to the t-test Menu: Go to
Stat>Basic Statistics>2-Sample t....- Select Columns: In the dialog box, specify the columns corresponding to the old and new process assembly times under “Sample 1” and “Sample 2.”
- Options: Click on
Optionsand make sure that you set the confidence level to 95% (which corresponds to α=0.05).- Run the Test: Click
OKto run the test.In this example output, the p-value is 0.0012, which is less than the significance level
α=0.05. Hence, you would reject the null hypothesis.
The t-statistic is -3.45, indicating that the mean of the new process is statistically significantly less than the mean of the old process, which aligns with your alternative hypothesis.
Showing the data displayed as a Box plot in the below graphic it is easy to see the new process is statistically significantly better.

You might ask, after all this why do a hypothesis test and not just look at the averages, which is a good question. While looking at average times might give you a general idea of which process is faster, hypothesis testing provides several advantages that a simple comparison of averages doesn’t offer:
Account for Random Variability: Hypothesis testing considers not just the averages, but also the variability within each group. This allows you to make more robust conclusions that account for random chance.
Quantify the Evidence: With hypothesis testing, you obtain a p-value that quantifies the strength of the evidence against the null hypothesis. A simple comparison of averages doesn’t provide this level of detail.
Control Type I Error: Hypothesis testing allows you to control the probability of making a Type I error (i.e., rejecting a true null hypothesis). This is particularly useful in settings where the consequences of such an error could be costly or risky.
Quantify Risk: Hypothesis testing provides a structured way to make decisions based on a predefined level of risk (the significance level, α).
Objective Decision Making: The formal structure of hypothesis testing provides an objective framework for decision-making. This is especially useful in a business setting where decisions often have to be justified to stakeholders.
Replicability: The statistical rigor ensures that the results are replicable. Another team could perform the same test and expect to get similar results, which is not necessarily the case when comparing only averages.
Understanding of Variability: Hypothesis testing often involves looking at measures of spread and distribution, not just the mean. This can offer additional insights into the processes you’re comparing.
Basis for Further Analysis: Once you’ve performed a hypothesis test, you can often follow it up with other analyses (like confidence intervals for the difference in means, or effect size calculations) that offer more detailed information.
In summary, while comparing averages is quicker and simpler, hypothesis testing provides a more reliable, nuanced, and objective basis for making data-driven decisions.
Having conducted the statistical test and obtained the p-value, you’re now at a stage where you can interpret these results in the context of the problem you’re investigating. This step is crucial for transforming the statistical findings into actionable insights.
The p-value you obtained tells you the significance of your results:
You should then relate these statistical conclusions to the real-world context of your problem. This is where your expertise in your specific field comes into play.
Example:
In our manufacturing example, if you’ve found a statistically significant reduction in assembly time with a p-value of 0.03 (which is less than the α level of 0.05), you can confidently conclude that the new manufacturing process is more efficient. You might then consider implementing this new process across the entire assembly line.
Based on your conclusions, you can make recommendations for action or further study. For example:
Lastly, it’s essential to document all the steps taken, the methodology used, the data collected, and the conclusions drawn. This documentation is not only useful for any further studies but also for auditing purposes or for stakeholders who may need to understand the process and the findings.
By the end of Step 5, you’ll have turned the raw statistical findings into meaningful conclusions and actionable insights. This is the final step in the hypothesis testing process, making it a complete, robust method for informed decision-making.
You’ve successfully conducted the hypothesis test and found strong evidence to reject the null hypothesis in favor of the alternative: The new assembly process is statistically significantly faster than the old one. It’s now time to interpret these results in the context of your business operations and make actionable recommendations.
Interpretation of Results
- Statistical Significance: The p-value of 0.0012 is well below the significance level of
α=0.05, indicating that the results are statistically significant.
- Practical Significance: The boxplot and t-statistic (-3.45) suggest not just statistical, but also practical significance. The new process appears to be both consistently and substantially faster.
- Risk Assessment: The low p-value allows you to reject the null hypothesis with a high degree of confidence, meaning the risk of making a Type I error is minimal.
Business Implications
- Increased Productivity: Implementing the new process could lead to an increase in the number of cars produced, thereby enhancing productivity.
- Cost Savings: Faster assembly time likely translates to lower labor costs.
- Quality Control: Consider monitoring the quality of cars produced under the new process closely to ensure that the speedier assembly does not compromise quality.
Recommendations
- Implement New Process: Given the statistical and practical significance of the findings, recommend implementing the new process across the entire assembly line.
- Monitor and Adjust: Implement a control phase where the new process is monitored for both speed and quality. This could involve additional hypothesis tests or control charts.
- Communicate Findings: Share the results and recommendations with stakeholders through a formal presentation or report, emphasizing both the statistical rigor and the potential business benefits.
- Review Resource Allocation: Given the likely increase in productivity, assess if resources like labor and parts need to be reallocated to optimize the workflow further.
By following this step-by-step guide, you’ve journeyed through the rigorous yet enlightening process of hypothesis testing. From stating clear hypotheses to interpreting the results, each step has paved the way for making informed, data-driven decisions that can significantly impact your projects, business, or research.
Hypothesis testing is more than just a set of formulas or calculations; it’s a holistic approach to problem-solving that incorporates context, statistics, and strategic decision-making. While the process may seem daunting at first, each step serves a crucial role in ensuring that your conclusions are both statistically sound and practically relevant.
A: Hypothesis testing is a statistical method used in Lean Six Sigma to determine whether there is enough evidence in a sample of data to infer that a certain condition holds true for the entire population. In the Lean Six Sigma process, it’s commonly used to validate the effectiveness of process improvements by comparing performance metrics before and after changes are implemented. A null hypothesis (H0) usually represents no change or effect, while the alternative hypothesis (H1) indicates a significant change or effect.
A: The choice of statistical test for hypothesis testing depends on several factors, including the type of data (nominal, ordinal, interval, or ratio), the sample size, the number of samples (one sample, two samples, paired), and whether the data distribution is normal. For example, a t-test is used for comparing the means of two groups when the data is normally distributed, while a Chi-square test is suitable for categorical data to test the relationship between two variables. It’s important to choose the right test to ensure the validity of your hypothesis testing results.
A: A p-value is a probability value that helps you determine the significance of your results in hypothesis testing. It represents the likelihood of obtaining a result at least as extreme as the one observed during the test, assuming that the null hypothesis is true. In hypothesis testing, if the p-value is lower than the predetermined significance level (commonly α=0.05), you reject the null hypothesis, suggesting that the observed effect is statistically significant. If the p-value is higher, you fail to reject the null hypothesis, indicating that there is not enough evidence to support the alternative hypothesis.
A: Type I and Type II errors are potential errors that can occur in hypothesis testing. A Type I error, also known as a “false positive,” occurs when the null hypothesis is true, but it is incorrectly rejected. It is equivalent to a false alarm. On the other hand, a Type II error, or a “false negative,” happens when the null hypothesis is false, but it is erroneously failed to be rejected. This means a real effect or difference was missed. The risk of a Type I error is represented by the significance level (α), while the risk of a Type II error is denoted by β. Minimizing these errors is crucial for the reliability of hypothesis tests in continuous improvement projects.

Daniel Croft is a seasoned continuous improvement manager with a Black Belt in Lean Six Sigma. With over 10 years of real-world application experience across diverse sectors, Daniel has a passion for optimizing processes and fostering a culture of efficiency. He's not just a practitioner but also an avid learner, constantly seeking to expand his knowledge. Outside of his professional life, Daniel has a keen Investing, statistics and knowledge-sharing, which led him to create the website www.learnleansigma.com, a platform dedicated to Lean Six Sigma and process improvement insights.

Improve your Lean Six Sigma projects with our free templates. They're designed to make implementation and management easier, helping you achieve better results.