Control Limits Calculator (UCL and LCL)
Control Limit Calculator
Upper Control Limit (UCL)
Lower Control Limit (LCL)
Control Limits
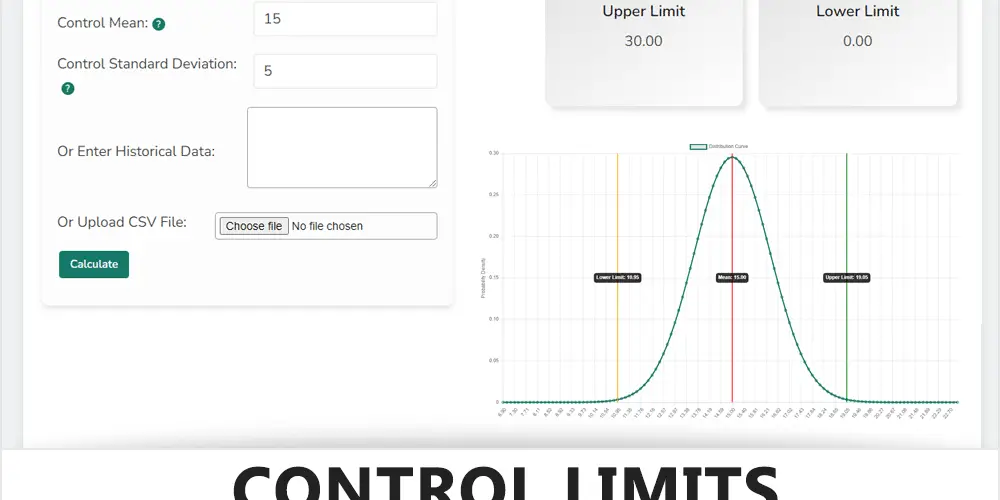
The Control Limit Calculator is a tool designed to calculate the upper and lower control limits for a process. These limits are essential in statistical process control, allowing you to monitor if a process is in control or needs adjustment.
How to use the Control Limits Calculator:
- Input Data: Choose one of the three methods to input data:
- Manually enter the mean and standard deviation.
- Input historical data in the provided text area.
- Upload a CSV file with your data.
- Calculate: Click the ‘Calculate’ button to process the input data.
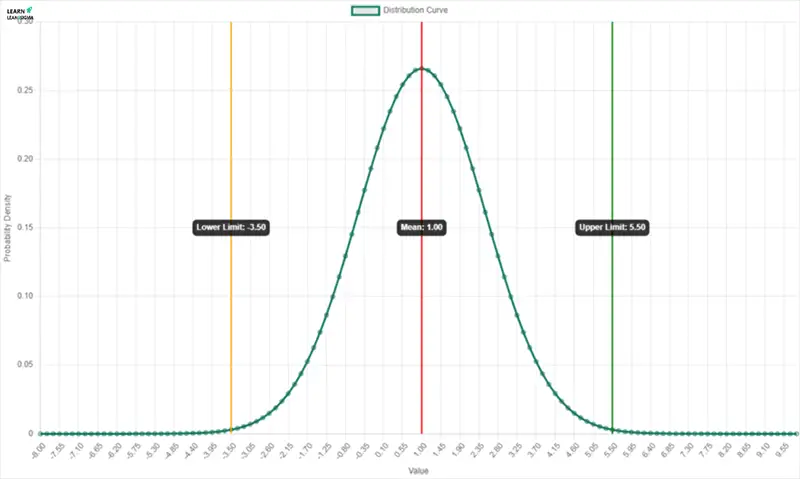
- Review Results: The upper and lower control limits will be displayed, along with a chart showing these limits.
- Export: Use the export buttons to download the results and chart as a PDF or image for documentation or presentations.
Understanding the Output
- Upper Limit: The highest value within which the process is considered in control.
- Lower Limit: The lowest value within which the process is considered in control.
- Chart: Shows the distribution of data relative to the calculated control limits.
Tips for Users
- Ensure data accuracy for meaningful results.
- Regularly update the calculator with new data for ongoing process monitoring.
- Use the export feature for sharing and documentation purposes.
- Pay attention to the feedback provided for any anomalies or trends in your data.
What are Control Limits?
Control limits are statistical boundaries set in process control charts used to determine whether a manufacturing or business process is operating within a state of statistical control. They are calculated using the process data’s mean and standard deviation and typically set at three standard deviations from the process mean. This creates an upper control limit (UCL) and a lower control limit (LCL).
If process data points fall within these limits, the process is considered to be in control and stable. However, if data points fall outside these limits, it may indicate a significant process variation or a shift, warranting investigation and potential corrective action. Control limits are not to be confused with specification limits, which are defined by customer requirements. Control limits are instead tools for understanding process variability and maintaining process control over time.
You can learn more about control limits with our Control charts guide.
Useful Templates
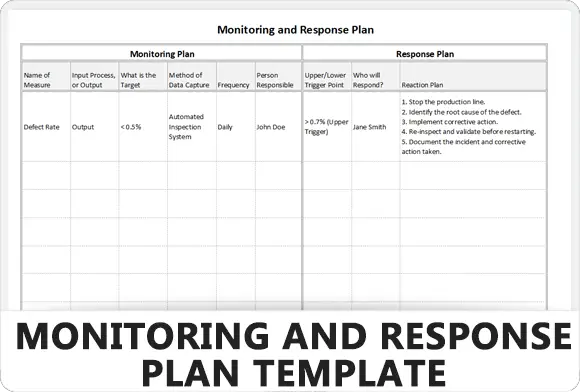
Template: Monitoring and Response Plan
The Excel template, rooted in Lean Six Sigma, aids in tracking and improving work processes in manufacturing, logistics, and warehousing…
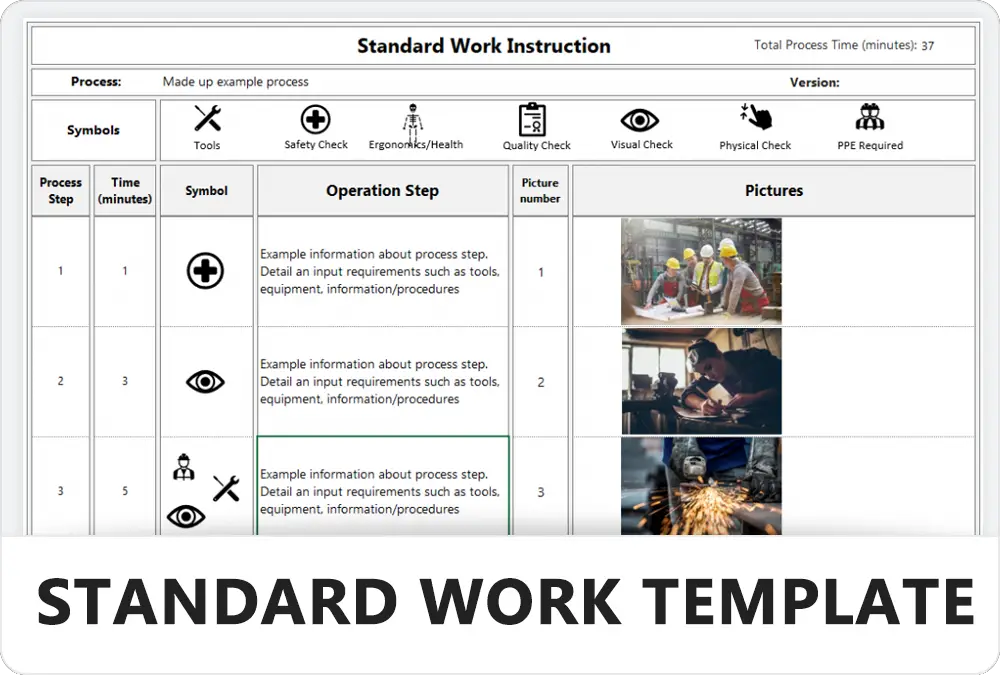
Standard Work Instructions Template (Excel)
Standard Work Instructions (SWI) Template (Excel and Google Sheet) The Standard Work Instructions (SWI) Excel Template and Google Sheets a…
Template: PICK Chart
Streamline project management with our free PICK Chart Template, designed to categorize and prioritize ideas effectively for better decision-making outcomes.…

