Fishbone Diagram Template for Root Cause Analysis

Download a free, editable Fishbone Diagram (Ishikawa) template in Excel format. Perfect for root cause analysis in Lean Six Sigma, Kaizen, or team problem-solving sessions.

★★★★★
4.8 879 reviews
108k + Downloads
Updated February 2026
Template Hero

About this Template

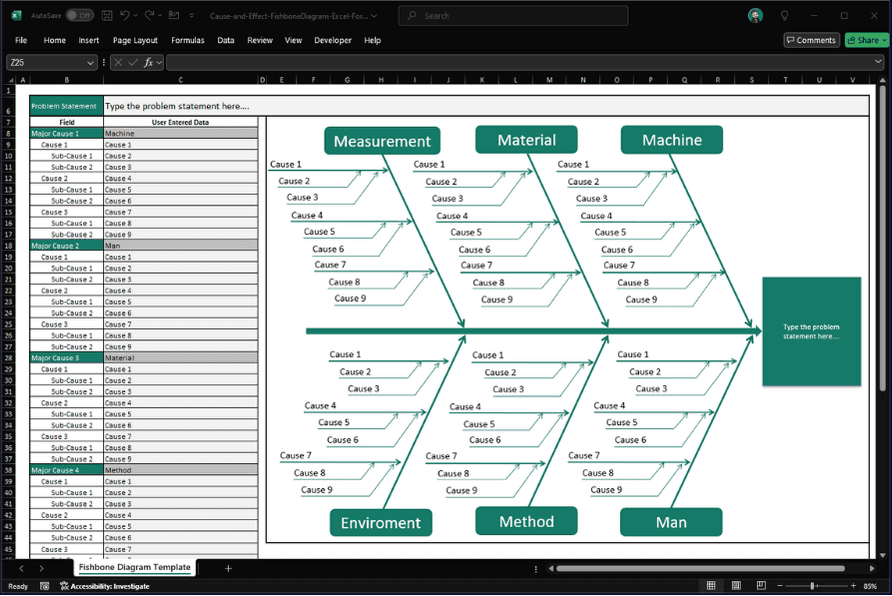
The Fishbone Diagram (also known as the Ishikawa or Cause-and-Effect Diagram) is the ultimate brainstorming tool for identifying the Root Cause of a problem. Instead of guessing, it forces your team to systematically categorize potential causes, ensuring no stone is left unturned.

This template is pre-structured with the classic "6 Ms" of manufacturing: Man, Machine, Material, Method, Measurement, and Mother Nature (Environment). Using this visual layout prevents "tunnel vision" and helps teams move from symptoms to actionable solutions.

Use this tool during the Analyze phase of DMAIC or whenever a complex problem requires a deep dive beyond the surface level.

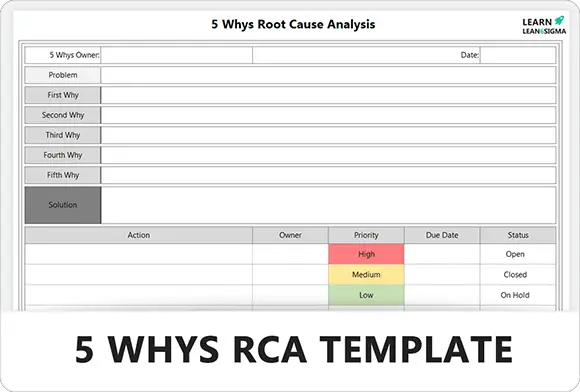
Pro Tip: Don't stop at the first layer. Once you identify a potential cause on a "bone," use the 5 Whys technique to drill down until you find the systemic failure.

Visual Structure

Maps the relationship between an Effect (the problem head) and its Causes (the bones).

Structured Ideas

Prevents chaotic brainstorming by forcing ideas into logical categories (The 6 Ms).

Root Cause Focus

Designed to pair with the 5 Whys to move past symptoms and find the true root cause.

The 6 Ms

Includes pre-filled categories for Man, Machine, Material, Method, Measurement, and Environment.

FREE

Join the 28-Day Lean Challenge

Take your skills to the next level. Join 15,000+ practitioners and get exclusive tools delivered to your inbox.

Daily Lessons 5 Bonus Templates PDF Guides
Start the Challenge

No spam. Unsubscribe anytime.

How to Perform a Fishbone Analysis

Also known as the Ishikawa or Cause-and-Effect diagram, this tool is essential for identifying the root cause of a problem, not just its symptoms.

Step 01

Define the Problem Statement

This is the "Head" of the fish. You must clearly articulate what is wrong. A vague problem statement leads to vague solutions.

  • Be Specific: "Machine 4 broke down" vs "Machine 4 overheated at 2 PM."
  • Focus: Write the problem on the far right side of the board.
  • Consensus: Ensure the whole team agrees on this statement before moving on.
Example:

"Late deliveries to the West Coast region increased by 15% in Q3."

PROBLEM !
Step 02

Brainstorm the 6 Ms

Draw the "Ribs" of the fish. These are your major categories. Using standard categories forces the team to look beyond the obvious.

  • Man: Is it a training or fatigue issue?
  • Machine: Is equipment failing or out of calibration?
  • Method: Is the standard procedure incorrect?
  • Material: Are there defects in the raw components?
Tip:

For office processes, you can use the 4 Ps: People, Process, Policy, and Place.

Man Machine Method Material
Step 03

Drill Down to Root Cause

This is where the magic happens. Don't just list symptoms; list causes. For each factor on a bone, ask "Why did that happen?" to add sub-bones.

  • 5 Whys: Keep asking why until you reach a systemic failure.
  • Sub-bones: Draw smaller lines off the main ribs for deeper causes.
  • Circle It: Identify the most likely root cause(s) to investigate further.
Example:

Machine stopped -> Fuse blew -> Overloaded motor -> Bearing seized -> Lack of lubrication schedule. (Root Cause)

Motor Fuse
Step 04

Validate & Act

A Fishbone Diagram is just a theory until tested. Take your top 2-3 potential root causes and verify them.

  • Verify: Go to the floor and turn the problem on/off by manipulating the cause.
  • Fix: Implement a countermeasure (Update SOP, change part, train operator).
  • Monitor: Watch the process to ensure the problem does not recur.
Next Step:

Move your findings into an A3 Report or Kaizen Charter to track the fix.

1. VALIDATE TEST TOGGLE CAUSE OFF ON 2. FIX & MONITOR STABLE
FAQ

Common Questions

When should I use a Fishbone Diagram?

Use it during the Analyze phase of DMAIC or any time a problem's cause is unknown. It is perfect for brainstorming sessions where the team needs to structure their ideas rather than randomly shouting out symptoms.

Is this different from the "5 Whys"?

They are complementary. The Fishbone Diagram helps you cast a wide net to identify all possible causes (Breadth). The 5 Whys helps you drill down into a specific cause to find the root (Depth). Usually, you use the Fishbone first, then apply 5 Whys to the top 2-3 factors.

Why use the 6 Ms instead of random categories?

The 6 Ms (Man, Machine, Material, Method, Measurement, Mother Nature) are a proven checklist. Without them, teams tend to focus only on "People" errors and miss systemic issues like poor training methods or faulty equipment calibration.

What if my problem has multiple root causes?

That is common. The Fishbone helps you map them all out. You can then use "Multi-Voting" (giving everyone 3 sticky dots to vote) to prioritize which root causes to attack first based on impact and ease of implementation.

Should I do this digitally or on a whiteboard?

Always start with a physical whiteboard or huge paper sheet for the brainstorming session—it encourages engagement. Use this digital template to document the final agreed-upon analysis for your official report or A3.
Free for Personal Use

Free

Instant Download • No CC Required

Download Excel
Secure SSL 256-bit Encrypted

What's Included

Free Template

Fishbone Diagram Template for Root Cause Analysis

Download Now

On this page