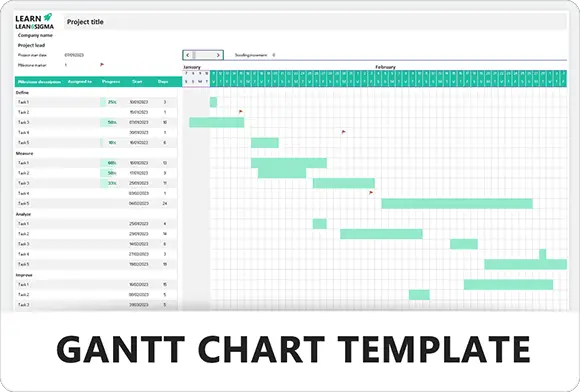
Gantt Chart Template

Streamline project planning with this dynamic Gantt Chart Template. Visualize timelines, manage dependencies, and track milestones to keep teams aligned and ensure successful, on-time project delivery.

★★★★★
4.1 88 reviews
1K + Downloads
Updated February 2026
Template Hero

About this Template

The Gantt Chart is the cornerstone of modern project management. It provides a visual timeline that illustrates your project schedule, from start to finish, breaking down complex deliverables into manageable tasks.

Essential during the Project Planning Phase, this tool allows teams to coordinate resources, estimate durations, and visualize the "Critical Path." It transforms a list of to-dos into an actionable roadmap.

Use this template to communicate timelines to stakeholders, identify potential bottlenecks before they occur, and track progress against your initial baseline.

Pro Tip: Pay close attention to Dependencies. Identify tasks that cannot start until a previous task is complete. This reveals the true duration of your project and prevents scheduling conflicts.

TASK NAME WEEK 1 WEEK 2 WEEK 3 WEEK 4 1. Project Planning 2. Development 3. Final Review

Visual Scheduling

Map tasks against time. See immediately when tasks begin, how long they take, and when they are scheduled to finish.

Dependencies

Link tasks to ensure correct sequencing. Identify which deliverables are prerequisites for others (Finish-to-Start).

Milestone Tracking

Mark major events and critical deadlines with zero-duration milestones to keep the team focused on key dates.

Progress Monitoring

Compare planned vs. actual progress. Shade bars to represent % complete and spot slippage early.

FREE

Join the 28-Day Lean Challenge

Take your skills to the next level. Join 15,000+ practitioners and get exclusive tools delivered to your inbox.

Daily Lessons 5 Bonus Templates PDF Guides
Start the Challenge

No spam. Unsubscribe anytime.

The 6-Step Scheduling Cycle

A systematic framework to break down projects, sequence activities, and build a robust timeline. This process transforms a goal into a visual roadmap.

Step 01

Define Tasks (WBS)

Start by breaking your project deliverables down into smaller, manageable chunks. This is your Work Breakdown Structure (WBS). Don't worry about dates yet; just capture the "What."

Goal:

A comprehensive task list where no single task is too large to track effectively.

Step 02

Sequence Activities

Determine the order of operations. Which tasks must finish before others can begin? Identify your dependencies (Finish-to-Start, Start-to-Start) to link tasks logically.

  • Predecessors: Tasks that must happen first.
  • Successors: Tasks that follow the predecessor.
A B DEPENDENCY
Step 03

Estimate Duration

How long will each task take? Assign a realistic time frame (hours, days, or weeks) based on available resources. Be wary of being overly optimistic.

Pro Tip:

Consider "buffer time" for high-risk tasks to accommodate unexpected delays.

Start Finish?
Step 04

Construct Schedule

Combine your tasks, dependencies, and durations onto the timeline. This is where the visual chart comes to life. Adjust start dates to account for resource availability.

  • Visualize: See the project flow horizontally.
  • Balance: Ensure no team member is overloaded.
Step 05

Identify Critical Path

Find the longest sequence of dependent tasks. If any task on this path is delayed, the entire project end date is delayed. These are your non-negotiable priorities.

Focus:

Tasks on the Critical Path have zero "float" or slack.

Step 06

Monitor & Control

A Gantt chart is a living document. Update progress regularly (e.g., % complete). If slippage occurs, adjust future tasks or add resources to get back on track.

  • Track: Planned vs. Actual dates.
  • Report: Keep stakeholders informed.
STATUS: ON TRACK
Scheduling FAQ

Gantt Chart Basics

What is the main purpose of a Gantt Chart?

It transforms a list of tasks into a visual timeline. Unlike a simple To-Do list, a Gantt chart shows you when tasks happen, how long they take, and how they overlap. It is the primary tool for communicating the project schedule to stakeholders.

What is the "Critical Path"?

The Critical Path is the longest sequence of dependent tasks in your project plan.

It determines the shortest possible time to complete the project. If any task on the critical path is delayed, the entire project end date slips. These tasks have zero "float" or slack.

What does a diamond symbol represent?

A diamond represents a Milestone. These are significant moments in time—such as project kickoff, design approval, or final launch—that represent progress.

Unlike standard tasks, Milestones have zero duration (0 days).
Launch!

What are Dependencies (e.g., FS, SS)?

Dependencies create a logical link between tasks. You cannot start framing a roof until the walls are built.
  • FS (Finish-to-Start): Task B starts when Task A finishes (Most common).
  • SS (Start-to-Start): Task B starts when Task A starts.
Task A Task B

Should I use Gantt or Kanban?

It depends on your view preference.

Gantt charts are best for high-level planning, dependencies, and seeing the "long game." Kanban boards are superior for daily task management and workflow execution. Most modern software lets you toggle between both views for the same project.
GANTT KANBAN

How do I handle project delays?

When a task takes longer than expected ("slippage"), you must update the duration. If you have set your Dependencies correctly, all downstream tasks will automatically shift to the right, giving you a new, realistic completion date immediately.
Planned Actual +3 DAYS
Free for Personal Use

Free

Instant Download • No CC Required

Download Excel
Secure SSL 256-bit Encrypted

What's Included

Free Template

Gantt Chart Template

Download Now

On this page