Balanced Scorecard Template
Align strategy with execution using this customizable Balanced Scorecard Template. Track objectives across financial, customer, process, and growth perspectives to drive performance and measure what truly matters.
★★★★★
3.9 55 reviews ↓ 5461 Downloads
↻ Updated February 2026

About this Template
The Balanced Scorecard (BSC) is a strategic management performance metric used to identify and improve various internal business functions and their resulting external outcomes. Unlike traditional reporting that looks only at financials, the BSC provides a "balanced" view of the organization.
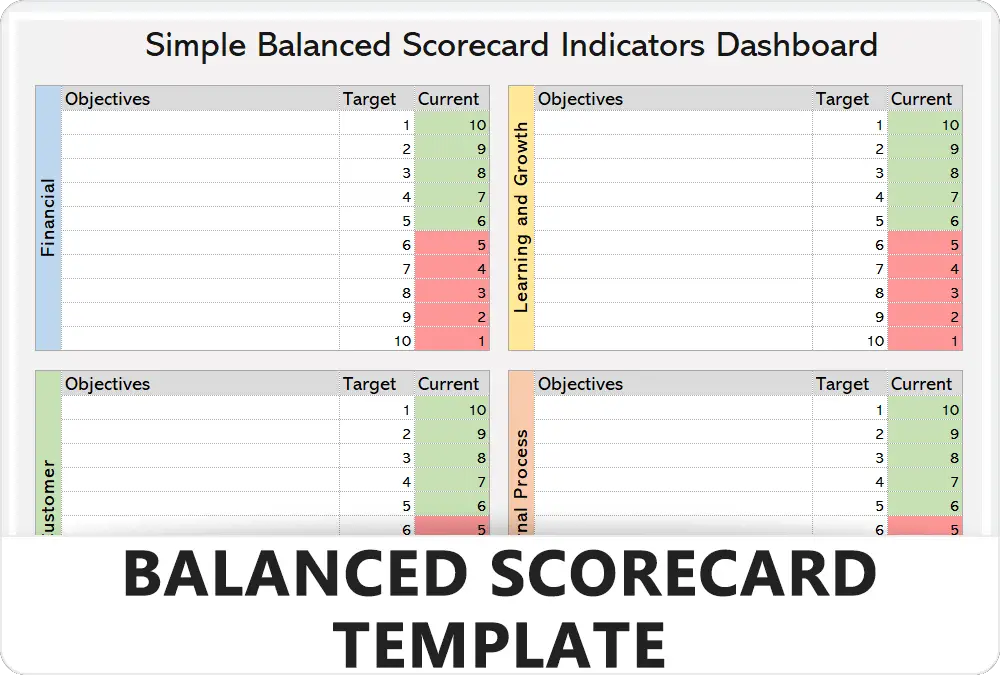
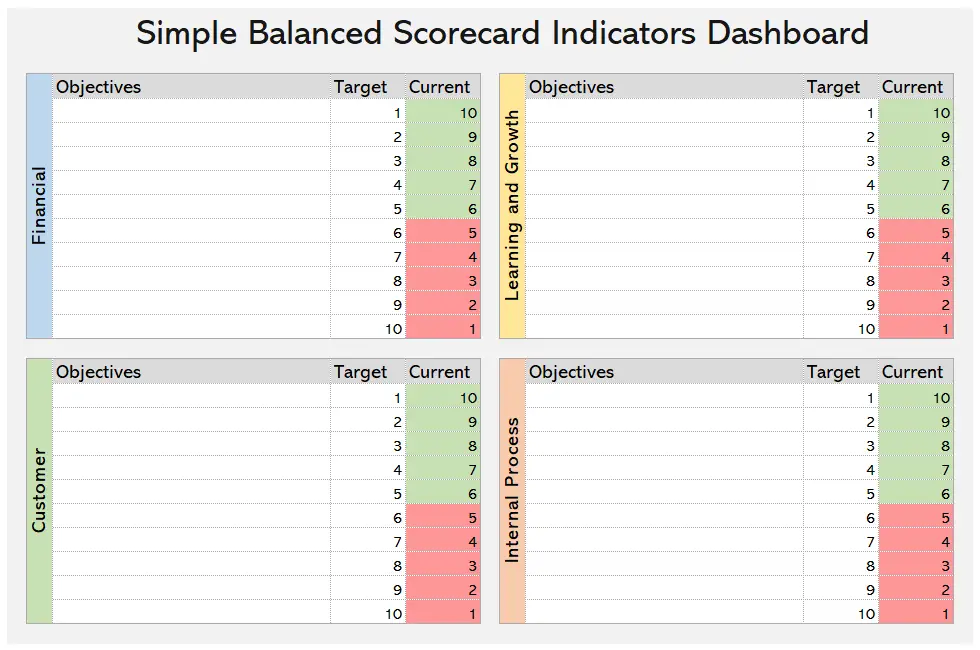
This template is structured to help you map objectives across the four standard perspectives: Financial, Customer, Internal Process, and Learning & Growth. This holistic approach aligns business activities to the vision and strategy of the organization, improves internal and external communications, and monitors organization performance against strategic goals.
While similar to Hoshin Kanri in its goal to deploy strategy, the Balanced Scorecard focuses heavily on maintaining equilibrium between short-term objectives and long-term sustainability.
Pro Tip: When defining your KPIs for each section, ensure they are interconnected. A "Learning & Growth" initiative (e.g., training) should directly improve an "Internal Process," which in turn drives "Customer Satisfaction" and "Financial Results."
The 4 Perspectives
Pre-formatted sections for Financial, Customer, Internal Processes, and Learning & Growth.
Cause & Effect Logic
Helps you visualize how improvements in culture and process eventually lead to financial success.
KPI & Targets
Dedicated columns to define your Lagging and Leading Indicators and set clear benchmarks.
Strategic Initiatives
Move beyond measurement to management by assigning specific projects to drive your targets.
Perfect For
Strategic Planning Performance Management Executive Reporting Goal Alignment
FREE
Join the 28-Day Lean Challenge
Take your skills to the next level. Join 15,000+ practitioners and get exclusive tools delivered to your inbox.
Daily Lessons 5 Bonus Templates PDF Guides
Start the Challenge
No spam. Unsubscribe anytime.
Facilitating a Balanced Scorecard Workshop
A step-by-step guide to translating your organization's mission into actionable performance measures across four perspectives.
Step 01
Clarify Vision & Strategy
Before you measure anything, you must agree on the destination. The "Financial" perspective is just a result; the Vision is the driver.
- Review: Analyze existing SWOT (Strengths, Weaknesses, Opportunities, Threats).
- Consensus: Ensure the leadership team agrees on the 3-5 year "North Star."
- Statement: Draft a clear strategic objective (e.g., "Become the #1 Eco-friendly supplier").
Facilitator Tip:
If the room cannot agree on the strategy, stop here. You cannot build a scorecard for a strategy that doesn't exist.
Step 02
Define Objectives by Perspective
Break the strategy down into the four classic BSC buckets. This ensures you aren't just looking at revenue.
- Financial: What must we achieve for shareholders?
- Customer: What do customers need to see from us?
- Internal Process: What operations must we excel at?
- Learning & Growth: How do we equip our people?
Rule of Thumb:
Limit yourself to 3-4 major objectives per perspective to keep the team focused.
Step 03
Build the Strategy Map
This is the most critical step. Connect the dots to tell a story of "Cause and Effect."
- Link Upwards: "If we Train Staff (Growth), they reduce Errors (Process)."
- Link to Outcomes: "If we reduce Errors (Process), Satisfaction rises (Customer)."
- Validate: Does the logic hold? If not, rewrite the objective.
Why do this?
A list of KPIs is boring. A Strategy Map is a story that employees can understand and follow.
Step 04
KPIs, Targets & Initiatives
Now you make it measurable. For every objective on the map, define how you will track success.
- Lagging Indicators: Look back at what happened (e.g., Revenue).
- Leading Indicators: Predict future success (e.g., Hours spent training).
- Initiatives: Specific projects assigned to teams to move the needle.
Example:
Objective: Improve Service. KPI: Avg Wait Time. Target: <2 mins. Initiative: Install new call routing software.
FAQ
Common Questions
How is this different from a standard report?
Standard reports are purely financial and look backward (e.g., "How much did we make last quarter?"). The Balanced Scorecard looks at the business holistically. It tracks the drivers of future success—like employee training and process efficiency—to ensure long-term health, not just short-term profit.
What are Leading vs. Lagging Indicators?
This is the most critical concept in the BSC.
Lagging Indicators tell you what happened (Outcome). Examples: Revenue, Accidents, Defect Rate.
Leading Indicators tell you if you are on track to achieve the outcome (Driver). Examples: Training Hours, Preventative Maintenance Completion, Customer Calls Answered.
A good scorecard has a mix of both.
Lagging Indicators tell you what happened (Outcome). Examples: Revenue, Accidents, Defect Rate.
Leading Indicators tell you if you are on track to achieve the outcome (Driver). Examples: Training Hours, Preventative Maintenance Completion, Customer Calls Answered.
A good scorecard has a mix of both.
How many KPIs should I have?
Less is more. A common mistake is turning the Scorecard into a data dump of 100+ metrics. Aim for 15-20 total KPIs across the entire organization (roughly 4-5 per perspective). If you measure everything, you focus on nothing.
Can I rename the perspectives?
Absolutely. While Kaplan and Norton defined the classic four (Financial, Customer, Process, Learning), you should adapt them to your context. For example, Non-Profits often move "Customer/Stakeholder" to the top and "Financial" to the bottom, as money is a resource to achieve the mission, not the mission itself.
Do I really need a Strategy Map?
You can run a scorecard without one, but you lose the "story." The Strategy Map visualizes the hypothesis: "If we train our people (Growth), they will build better widgets (Process), which delights buyers (Customer), leading to higher sales (Financial)." It aligns the team on cause-and-effect.
Related Templates
View Library
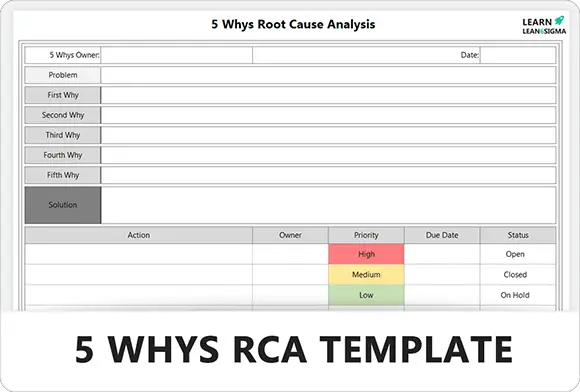
Root Cause Analysis5 Whys Template
4.2
33K +
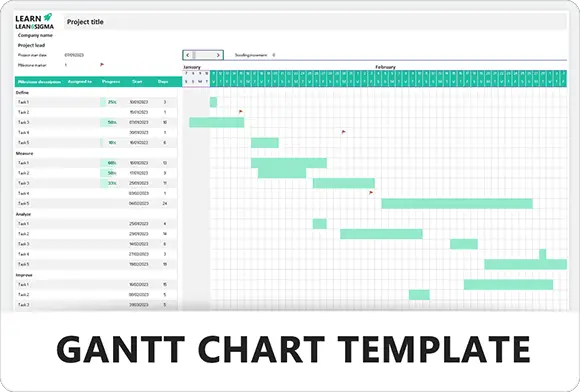
TemplateGantt Chart Template
4.1
1K +
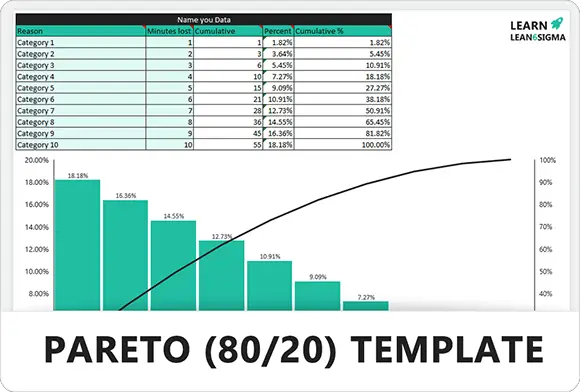
Root Cause AnalysisPareto (80/20) Template
4.1
1467
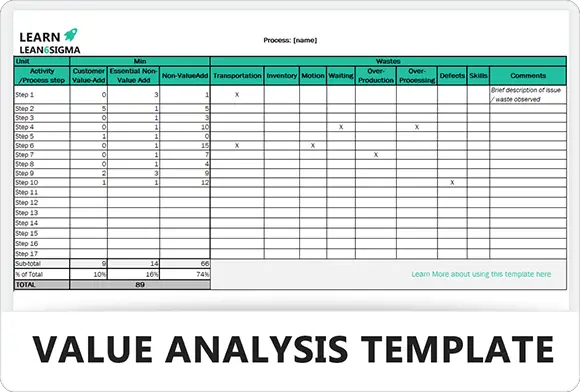
TemplateValue Add Analysis Template
4.7
11K +
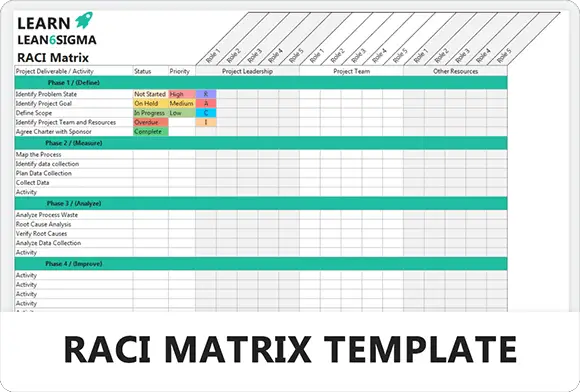
TemplateRACI Matrix Template
4.3
28K +
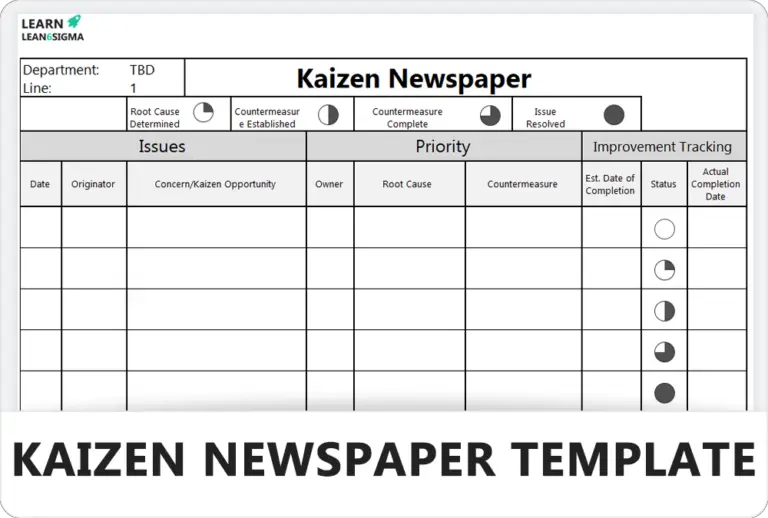
TemplateKaizen Newspaper Template
4.7
13K +
PrioritisationImpact and Effort Matrix Template
3.6
5K +
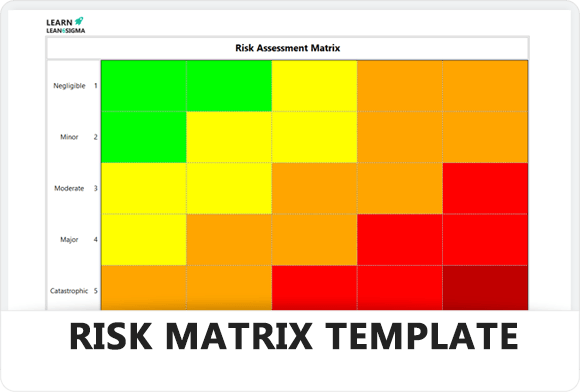
Risk ManagementRisk Assessment Matrix Template
4.1
8.9K
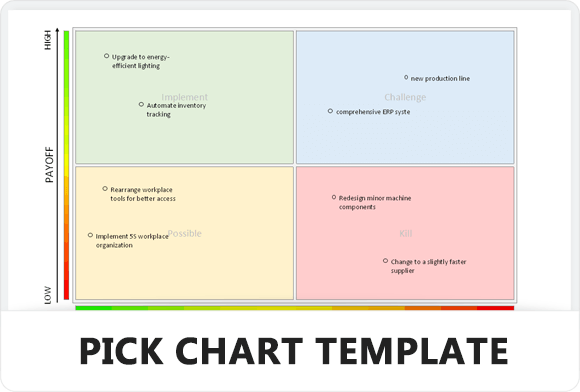
PrioritisationPICK Chart Template
4.0
10K +
Root Cause AnalysisA3 Problem Solving Template
4.7
53K +
Six SigmaAction List Template
3.7
1K +
Risk ManagementRisk Assessment Template
4.4
14K +
StrategyStakeholder Priortization Matrix Template
4.2
8k +
TemplateLessons Learned Template
3.8
2.5K +
TemplateHistogram Template
3.8
1K +
5S5S Audit Trend Template
4.4
45K +
Six SigmaDMAIC Project Report Template
4.7
120K +
Six SigmaIs/Is Not Template
4
4K +
TemplateScatter Plot Template
4.0
3K +
Six SigmaCommunication Plan Template
4.4
7K +
Root Cause AnalysisFishbone Diagram Template for Root Cause Analysis
4.8
108k +
Risk ManagementRAID Log Template
4.5
65K +
Risk ManagementFMEA Template for Risk Analysis and Failure Prevention
4.8
85k +
Risk ManagementControl Plan Template
4.3
4K +
Free for Personal Use
Free
Instant Download • No CC Required
Download Excel Secure SSL 256-bit Encrypted
What's Included
Free Template
Balanced Scorecard Template