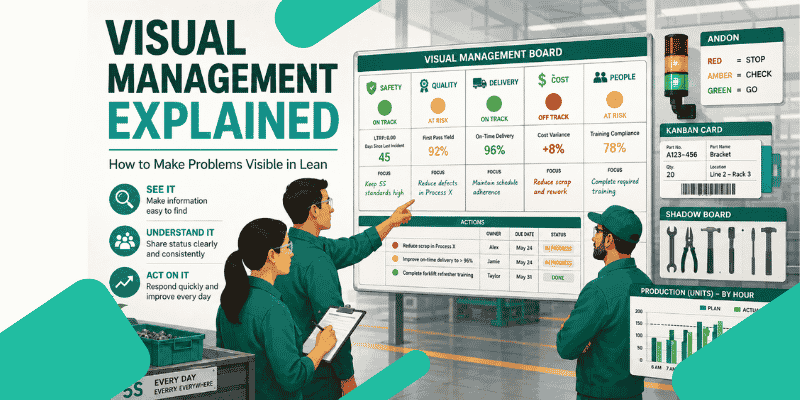
A production line misses its target by 20%.
The data exists somewhere. It might be in a spreadsheet, an ERP system, a supervisor’s notebook or an email sent after the shift has ended. Someone may notice the gap tomorrow. Someone may ask what happened in next week’s meeting.
By then, the shift is over and the opportunity to respond has already gone.
That is the problem visual management is designed to solve. It makes process status, standards, abnormalities and actions visible at the point of work so teams can understand what is happening and respond quickly.
Good visual management is not about making colourful boards. It is about making the difference between normal and abnormal obvious enough that people can act before small issues become larger problems.
Toggle between a hidden problem and a visible problem response.
What Is Visual Management?
Visual management is a Lean method for making process status, performance, standards, abnormalities and actions visible so teams can understand and respond quickly.
In simple terms, visual management helps people answer five questions without needing to search through reports or wait for a meeting:
- What should be happening?
- What is actually happening?
- Is there a gap between target and actual?
- Who is responding to the gap?
- What action is needed next?
This is why visual management is closely connected to standard work, Gemba walks, root cause analysis and daily management. A visual system should show the expected condition, reveal when the process is off-track, and make the response clear.
Simple Definition
Visual management is the practice of making standards, performance, problems and actions visible so teams can see whether the process is normal or abnormal and respond quickly.
The key word is response. A board that only displays data is not automatically visual management. If a red KPI stays red for days with no owner, no action and no escalation, the board is not managing anything. It is just decoration.
Visual management connects standard, actual, gap, response and learning.
Visual Management vs Visual Controls
Visual management and visual controls are often used as if they mean the same thing, but there is an important difference.
Visual management is the wider system. It includes the standards, signals, boards, meetings, ownership and escalation routines that help a team manage the process. Visual controls are the specific signals or tools used inside that system.
| Term | Meaning | Example |
|---|---|---|
| Visual Management | A system for making performance, standards, problems and actions visible. | Tier board, Gemba board or daily management board. |
| Visual Control | A specific signal that guides behaviour or triggers action. | Kanban card, red tag, Andon light or shadow board. |
| Visual Display | Information shown visually so it is easier to understand. | KPI chart, schedule board or skills matrix. |
| Visual Standard | A visible example of the expected condition. | Photo standard, 5S layout, minimum and maximum stock level. |
A shadow board is a visual control because it shows where tools should be placed. A daily management board is part of visual management because it helps a team review performance, identify gaps, assign actions and escalate issues. Both can be useful, but they operate at different levels.
Click each layer to see how visual management becomes a management system.
Why Visual Management Matters in Lean
Visual management matters because many process problems are not difficult to solve once they are visible. The problem is that they are often noticed too late, discussed in the wrong place, or hidden inside systems that the people doing the work do not use during the shift.
In Lean, visual management supports flow by exposing abnormalities. A missing material, delayed changeover, late job, quality issue or staffing gap should not need detective work. The team should be able to see the condition quickly and decide what to do next.
Good visual management helps teams:
- Expose abnormalities while there is still time to respond.
- Reduce reaction time when safety, quality, delivery or cost issues appear.
- Align teams around the same priorities and facts.
- Improve shift handovers and daily communication.
- Connect KPIs to action rather than passive reporting.
- Support escalation when issues cannot be solved locally.
- Sustain standard work by showing when the process has drifted.
A good visual system does not just show information. It changes behaviour by making the next response clear.
Visual management reduces the time between abnormality and response.
Examples of Visual Management in Manufacturing
Visual management can take many forms. Some examples are simple, such as a label or floor marking. Others are part of a wider management system, such as a daily management board. The right option depends on what the team needs to see and what response the visual should trigger.
Below are common examples used in manufacturing and operational environments.
Daily Management Board
Shows safety, quality, delivery, cost, people, actions and escalations. It helps the team review performance and respond to gaps during regular meetings.
Andon Signal
Shows process status using simple signals such as green for normal, amber for help needed and red for stopped or abnormal.
5S Shadow Board
Shows the expected location of tools and makes missing items obvious. This supports workplace organisation and reduces searching.
Kanban Signal
Shows when material should be replenished. A good Kanban signal prevents stockouts and overproduction.
Hour-by-Hour Board
Shows plan vs actual output during the shift. This makes output gaps visible before the end of the day.
Red Tag Area
Shows abnormal, unnecessary or unassigned items that need a decision. It is commonly used during 5S and workplace improvement.
The strongest visual systems are close to the work and connected to real decisions. A production board on the shop floor usually has more value than a dashboard that only managers review in an office. Digital dashboards can help, but they should not replace local visibility where immediate action is needed.
Examples of visual management in manufacturing and operational environments.
Interactive Visual Management Board Example
A visual management board should help the team manage the process, not just present information. This is where many boards fail. They have charts, colours and action lists, but nobody uses them to make decisions.
A useful daily management board normally includes sections for:
- Safety — incidents, hazards, near misses and safety actions.
- Quality — defects, rework, scrap, customer issues or process checks.
- Delivery — plan vs actual, schedule adherence, output gaps and late work.
- Cost — waste, downtime, labour efficiency, consumables or cost-saving actions.
- People — attendance, skills, training, support needs and team concerns.
- Actions — owner, due date, status and escalation.
Each section should make target vs actual clear. If the status is red or amber, the team should know what the issue is, who owns the response and when it will be reviewed.
Click each board section or simulate a bad day to see how the board should trigger action.
Notice the difference between a board that simply reports performance and a board that drives response. The purpose is not to make the area look organised for visitors. The purpose is to help the team manage the work while the work is happening.
How Visual Management Supports Daily Management
Visual management is one of the foundations of daily management. Without clear visual information, daily meetings can become general conversations, status updates or management presentations. With clear visual information, the team can focus on gaps, actions and escalation.
A good daily management routine uses visual management to:
- Review performance quickly.
- Identify abnormalities against target or standard.
- Assign actions to named owners.
- Escalate blockers that cannot be solved locally.
- Review whether previous actions were completed.
- Learn from recurring issues and feed them into structured problem solving.
This is the difference between a board that displays data and a board that supports management behaviour. The board should guide the conversation toward the process, the abnormality and the response.
Daily management turns visual gaps into action and escalation.
What Makes Good Visual Management?
Good visual management should be simple enough to understand quickly and useful enough to guide action. If people need five minutes to interpret the board, it is not visual enough. If the board is clear but nobody acts on it, it is not management.
Strong visual management usually has seven characteristics:
Good Visual Management
- Visible at the point of work.
- Easy to understand in seconds.
- Linked to a standard, target or expected condition.
- Updated at the right frequency.
- Owned by the team using the process.
- Connected to action and escalation.
- Used in a routine meeting or review.
Weak Visual Display
- Too many measures and no clear priority.
- Data shown without a target.
- Red status with no owner or action.
- Updated only before audits or visits.
- Owned by managers instead of the team.
- Located away from the work.
- Used as a presentation board rather than a management tool.
The best visual boards are used by the team, not presented to the team. They should help operators, team leaders, supervisors and managers see the same facts and agree the next action.
Score whether your visual management is only a display or a working management system.
How to Create Visual Management Step-by-Step
Do not start by designing a board. Start by understanding what the process needs to manage. Many visual boards fail because people create sections, charts and colours before they understand the process, the standard or the required response.
Use the steps below to create visual management that supports the work rather than adding another layer of administration.
Define the Process or Area
Choose the scopeDecide which process, cell, team, value stream or area the visual system will support. Avoid creating generic boards that try to manage everything. A clear scope makes the visual system easier to design and maintain.
Visuals need a standard. Define what normal should look like. This may include the output target, staffing level, material level, quality requirement, schedule, work sequence or expected workplace condition.Identify the Expected Condition
Define normal
List the issues the team needs to see quickly. Examples include downtime, defects, missed output, late materials, safety concerns, staffing gaps, rework, waiting time or overdue actions.Decide What Abnormalities Must Be Visible
Expose the gap
Choose the simplest visual method that fits the problem. This might be a board, light, label, floor marking, Kanban card, checklist, chart, shadow board or red tag system.Choose the Right Visual Method
Select the signal
Put visual management close to the process where possible. If the team needs to respond during the shift, hiding the visual in an office, spreadsheet or digital report will reduce its practical value.Place It Where the Work Happens
Make it usable
Decide what happens when the visual shows an abnormality. Who responds? How quickly? What gets escalated? Where are actions recorded? A red condition without a response is just a warning light with no system behind it.Define the Response
Make action clear
Review whether the visual system is being used, whether actions are completed and whether the information is still useful. Visual management should evolve as the process changes.Review and Improve
Keep it alive
Hour-by-Hour Production Board Example
One of the clearest examples of visual management is an hour-by-hour production board. This is useful when a team needs to understand whether output is on plan during the shift, not after the shift has already finished.
Imagine a production cell that needs to produce 10 units per hour. Before visual management, output is recorded at the end of the shift. If the team finishes short, leaders may only discover the problem when it is too late to recover. Operators may remember some issues, but the detail is often incomplete by the time the review happens.
After visual management, the team records plan, actual, gap, reason and action throughout the shift. When the actual output is below plan, the gap becomes visible and the response can happen immediately.
| Hour | Plan | Actual | Gap | Reason | Action |
|---|---|---|---|---|---|
| 08:00 | 10 | 9 | -1 | Material late | Escalated to supply. |
| 09:00 | 10 | 10 | 0 | — | — |
| 10:00 | 10 | 7 | -3 | Machine stop | Maintenance called. |
This kind of board works because it supports response during the shift. It also creates better problem-solving data because the reason for the gap is captured close to when the issue happened. If the same reason appears repeatedly, the team can move it into 5 Whys, fishbone analysis or an A3 problem-solving process.
Run the shift to see how an hour-by-hour board exposes gaps before the end of the day.
Common Visual Management Mistakes
Visual management is simple in principle, but easy to weaken in practice. The common failure mode is creating something that looks like Lean but does not help the team manage the process.
Making Boards Too Complicated
If people need five minutes to understand the board, it is not visual enough. Use fewer measures and make the status obvious.
No Target or Standard
Data without a target does not show abnormality. The team needs to see what should be happening and what is actually happening.
No Action Response
A red KPI without an owner, action or escalation is decoration. Every abnormality needs a clear response path.
Managers Own the Board
Visual management should help the team manage the process. If the board is only updated for management review, ownership will be weak.
Boards Are Not Updated
Outdated boards destroy trust. If the information is not current enough to support decisions, people will stop using it.
Too Much Digital, Not Enough Point-of-Use
Digital dashboards can be useful, but many shop-floor problems need local visibility where the work is happening.
Compare a weak visual board with a board that drives ownership and action.
A useful test is to stand in front of the board and ask: does this help the team see the gap, decide the response and follow up action? If the answer is no, the board needs simplifying or reconnecting to the management routine.
Download a Visual Management Board Template
If you want to build a practical board, use a visual management board template to define the sections, targets, actual performance, issues, owners, actions and escalation status.
You can also support the system with a daily management board template, action plan template, KPI template and Gemba walk checklist.
Frequently Asked Questions
What is visual management in Lean?
Visual management is the use of boards, signals, labels, charts and standards to make process status and abnormalities visible. The aim is to help teams see whether the process is normal or abnormal and respond quickly.
What is an example of visual management?
An hour-by-hour production board showing planned output, actual output, reasons for gaps and actions is a practical example. It helps the team respond during the shift instead of waiting until the end of the day.
What is the difference between visual management and visual controls?
Visual management is the overall system for making performance, standards, problems and actions visible. Visual controls are individual signals or tools within that system, such as Kanban cards, red tags, Andon lights or shadow boards.
Why is visual management important?
Visual management is important because it helps teams see problems quickly, respond faster, align around priorities, improve handovers and sustain process standards.
What should be on a visual management board?
A good visual management board usually includes key KPIs, target vs actual performance, issues, actions, owners, due dates and escalation status. The exact content should match the process being managed.
Is visual management only for manufacturing?
No. Visual management can be used in offices, supply chain, maintenance, project management, healthcare, service processes and any environment where teams need to see status, problems and actions clearly.
References and Further Reading
The following external resources provide additional background on visual management and Lean visual controls. They are included as supporting references for readers who want to explore the topic further.
Lean Enterprise Institute: Visual Management
The Lean Enterprise Institute provides a concise definition of visual management and explains how it helps people understand the status of a system at a glance.
ASQ: Visual Management
ASQ provides a useful overview of visual management as a way to make workplace performance conditions visible and highlight problem areas.
