Choosing the right tool for identifying root causes is critical in the pursuit of continuous improvement. The Fishbone Diagram (Ishikawa Diagram) and the 5 Whys Analysis are two widely used tools in this field. Though both seek to identify the root causes of problems, their approaches and applications differ. The Fishbone Diagram uses a structured layout to visualize cause-and-effect relationships, whereas the 5 Whys Analysis uses iterative questioning to drill down to the core issue.
Understanding the complexities of both tools is critical for process improvement specialists, quality analysts, and anyone else interested in increasing organizational efficiency. In this comprehensive comparison, we’ll look at the strengths, weaknesses, similarities, and differences between these two methodologies, empowering you to make informed decisions on your journey to continuous improvement.
The Fishbone Diagram
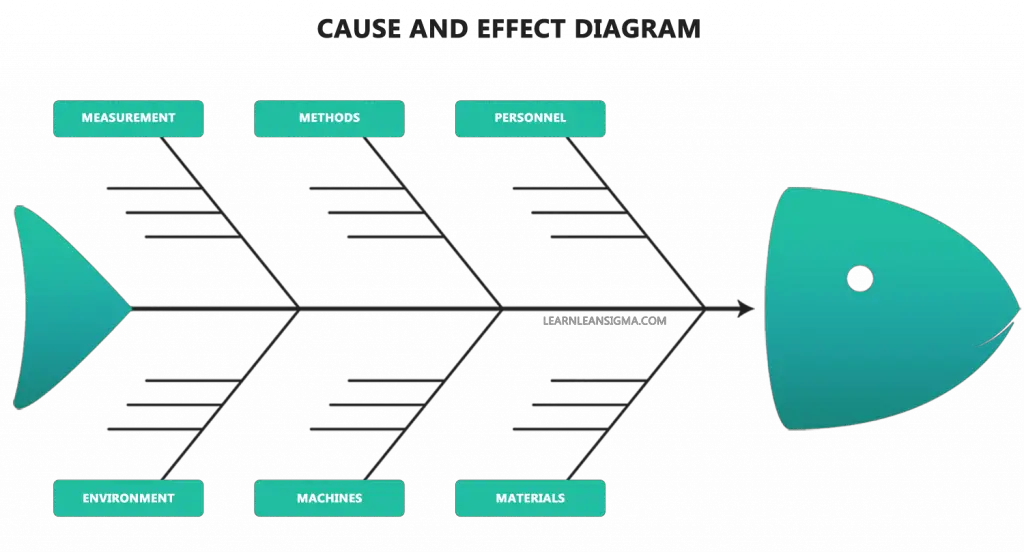
The Fishbone Diagram, also known as the Ishikawa Diagram or Cause-and-Effect Diagram, is a graphical tool for identifying and visualizing the potential causes of a problem or effect. It gets its name from its resemblance to a fish’s skeleton, with the “head” representing the main problem and the various contributing factors representing the “bones.”
Structure and Goal
The Fishbone Diagram is designed to encourage in-depth investigation of potential causes. It aids teams in categorizing, visualizing, and delving into the underlying causes of a problem. It fosters a deeper understanding and targeted problem-solving by clearly mapping out the relationships between the effect and its contributing factors.
The Fishbone Diagram is an invaluable tool for promoting systematic analysis and continuous improvement when tackling complex organizational challenges or addressing specific process inefficiencies.
Example: Improving Production Efficiency in Automotive Manufacturing
In my role as a Continuous Improvement Manager in the automotive industry, We regularly face challenges in such as reducing production downtime for example. Utilizing the Fishbone Diagram is a good method to use to systematically identify the underlying causes.
Here’s how we approached it:
- Problem (Head): Increased production downtime.
- Main Categories (Bones): We divided the potential causes into six main categories: People, Processes, Machines, Materials, Environment, and Management.
- Detailed Analysis: Under each category, we listed specific issues. For example, under “Machines,” we identified outdated equipment, frequent breakdowns, and inadequate maintenance.
- Solutions: By analyzing these factors, we developed targeted solutions like equipment upgrades and preventive maintenance schedules.
5 Whys Analysis
The 5 Whys Analysis is a simple yet effective tool for determining the root cause of a problem by repeatedly asking “Why?” until the underlying issue is discovered. It emphasizes an iterative questioning process that digs beneath the surface of the problem, allowing for a more profound understanding of the issue.
What exactly is the 5 Whys Analysis?
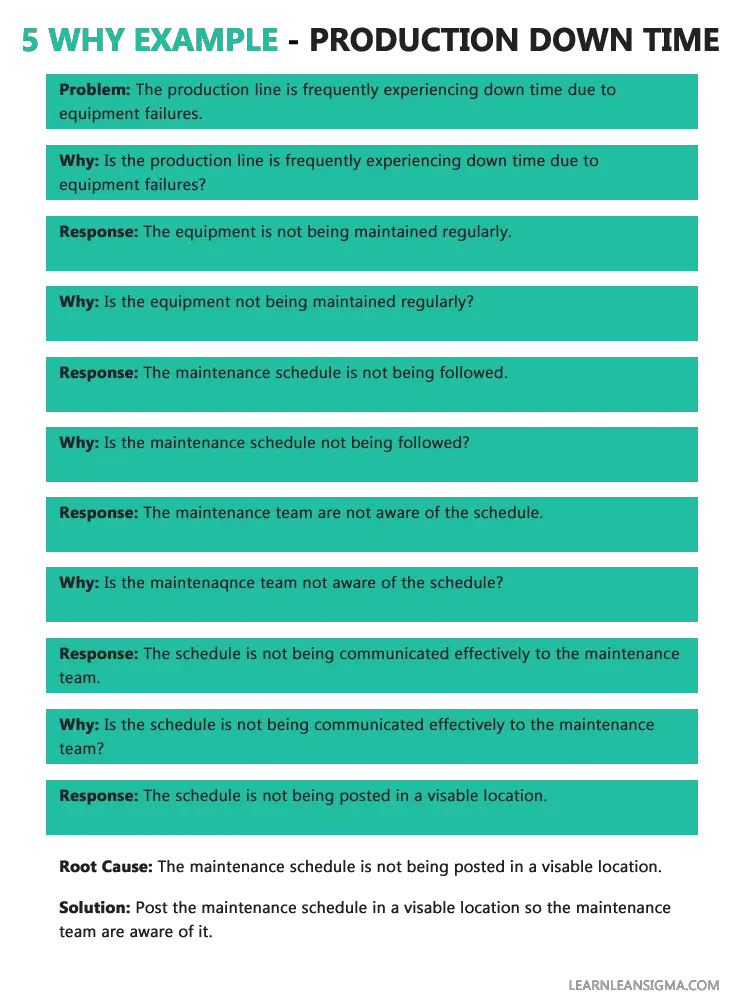
The Five Whys Analysis involves asking “Why?” five times (or as many times as necessary) to get to the bottom of the problem. Each response serves as the foundation for the next question. It promotes critical thinking and ensures that solutions address the root cause rather than just the symptoms.
Iterative Questioning Process
- State the Problem: Start with a clear definition of the problem.
- Ask “Why?”: Ask why the problem occurred and document the answer.
- Repeat: Continue asking “Why?” to each answer until the root cause is identified.
- Implement Solutions: Develop and apply solutions targeting the root cause.
Example: Delay in Product Delivery
- Why is the product delivery delayed? Lack of inventory.
- Why is there a lack of inventory? Supplier issues.
- Why are there supplier issues? Inadequate communication and planning.
- Why is communication inadequate? Lack of a coordinated communication strategy.
- Why is there no coordinated strategy? Absence of a clear supply chain policy.
This leads to the root cause and enables the development of a targeted solution.
Comparing Fishbone and 5 Whys
Now that we have covered the basics of each of the Root Cause Analysis (RCA) tools, let’s compare them to help you understand which tool to use and when.
Similarities:
- Root Cause Identification: Both tools focus on identifying the underlying causes of a problem, encouraging systematic analysis.
- Problem-Solving: They promote critical thinking and targeted problem-solving by breaking down complex issues into manageable parts.
Differences:
- Structure: The Fishbone Diagram uses a visual layout resembling a fish’s skeleton, while the 5 Whys relies on iterative questioning.
- Complexity: The Fishbone Diagram often includes multiple categories and subcategories, making it suitable for complex problems. In contrast, the 5 Whys is simpler and more linear.
- Applicability: The Fishbone may be preferred for multifaceted problems with many variables, while the 5 Whys is often used for more straightforward issues.
- Ease of Use: The 5 Whys is generally quicker and easier to use, while the Fishbone Diagram requires more careful categorization and analysis.
| Aspect | Fishbone Diagram | 5 Whys Analysis |
|---|---|---|
| Structure | Visual, categorized | Linear, iterative |
| Complexity | Suitable for complex issues | Ideal for simpler problems |
| Applicability | Multifaceted problems | Straightforward issues |
| Ease of Use | More detailed | Quicker, easier |
Understanding these similarities and differences allows practitioners to choose the best tool for their specific needs, ensuring effective problem-solving and continuous improvement.
Practical Application of the Fishbone Diagram and 5 Whys Analysis
Understanding the strengths and weaknesses of the Fishbone Diagram and Five Whys Analysis is essential, but knowing how to apply these tools in real-world scenarios is what truly unlocks their value. Below, we’ll explore when to use each tool and offer practical guidance for implementation.
When to Use Each Tool
- Fishbone Diagram:
- Complex Problems: When dealing with multifaceted issues with numerous potential causes.
- Collaborative Analysis: Ideal for team brainstorming sessions, promoting cross-functional collaboration.
- 5 Whys Analysis:
- Straightforward Issues: Best suited for simpler problems that don’t require extensive categorization.
- Quick Insights: When a rapid analysis is needed to identify a root cause without extensive detailing.
Practical Tips for Implementation
- Fishbone Diagram:
- Define the Problem Clearly: Start with a clear and concise problem statement.
- Brainstorm Categories: Identify the main categories or “bones” that may contribute to the problem.
- Dig Deeper: Encourage team members to think critically and identify sub-causes within each category.
- Analyze and Prioritize: Use the diagram to pinpoint high-impact areas and develop targeted solutions.
- 5 Whys Analysis:
- Start with a Clear Question: Focus on a specific problem or symptom.
- Encourage Honesty: Foster an environment where team members feel comfortable answering honestly.
- Document the Process: Keep a record of each “Why?” and answer to ensure a logical flow.
- Validate the Root Cause: Ensure that the identified root cause is supported by evidence.
Downloadable Template
- 5 Whys Analysis Template: Download Here
Conclusion
In the world of continuous improvement, the tools used are just as important as the methods used. Despite their differences in structure and complexity, the Fishbone Diagram and the 5 Whys Analysis provide invaluable insights into determining root causes. Practitioners can tailor their approach to the problem at hand by understanding their distinct characteristics and knowing when to apply each.
These tools enable teams to think critically and act decisively, whether dissecting a multifaceted challenge with the detailed visualization of the Fishbone Diagram or quickly drilling down to the core issue with the 5 Whys. The templates and practical tips provided are intended to provide you with the resources you need to effectively implement these methodologies. Including these tools in your continuous improvement journey opens up new opportunities.
References
- Card, A.J., 2017. The problem with ‘5 whys’. BMJ quality & safety, 26(8), pp.671-677.
- Benjamin, S.J., Marathamuthu, M.S. and Murugaiah, U., 2015. The use of 5-WHYs technique to eliminate OEE’s speed loss in a manufacturing firm. Journal of Quality in Maintenance Engineering, 21(4), pp.419-435.
- Rooney, J.J. and Heuvel, L.N.V., 2004. Root cause analysis for beginners. Quality progress, 37(7), pp.45-56.
- Peerally, M.F., Carr, S., Waring, J. and Dixon-Woods, M., 2017. The problem with root cause analysis. BMJ quality & safety, 26(5), pp.417-422.

