Process Capability Index (Cpk) is a powerful statistical tool used in Statistical Process Control (SPC) to assess the performance and capability of a process. In today’s competitive business environment, process quality and stability are critical for delivering high-quality products or services, meeting customer expectations, and maintaining a competitive edge. Cpk provides important insights into a process’s ability to meet specifications and produce consistent results, making it an indispensable tool for quality professionals and process engineers.

Take the Process Capability Quiz
Test your knowledge on Process Capability with this quiz. Click the button below to get started!

Question text will go here
Your result message will appear here.
Your score:
What is Process Capability Index (Cpk)?
The Process Capability Index is a statistical measure that quantifies a process’s ability to meet specifications. It outputs a numerical value indicating the level of process performance in relation to specification limits. Understanding Cpk calculation and interpretation is critical for evaluating and improving process capability.
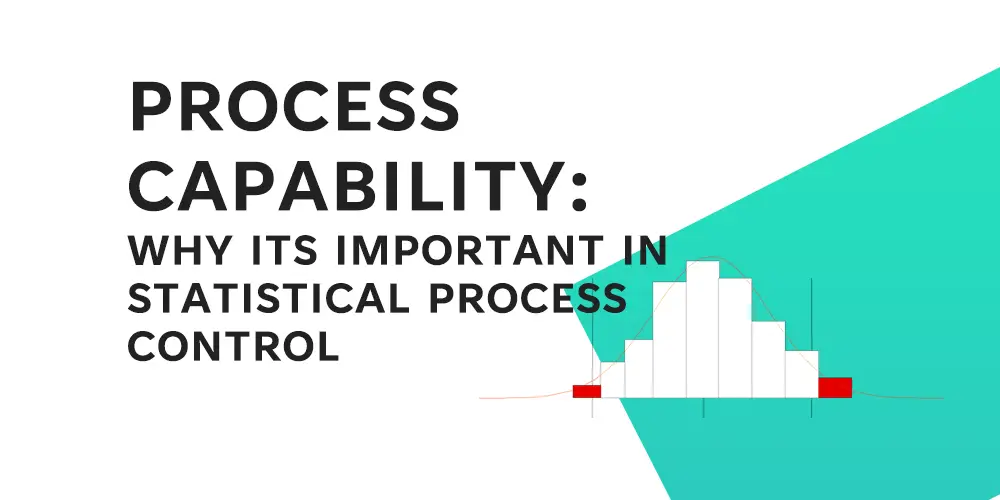
The histogram below represents the spread of data in relation to its spec limits (LSL) and (USL) Often set by customers either internally or externally. The variation of the output within the spec limits shown in teal and would be accepted by the customer. However, the outputs that are depicted in red have been produced outside the customer’s spec limits and would be rejected and therefore scrap or waste.

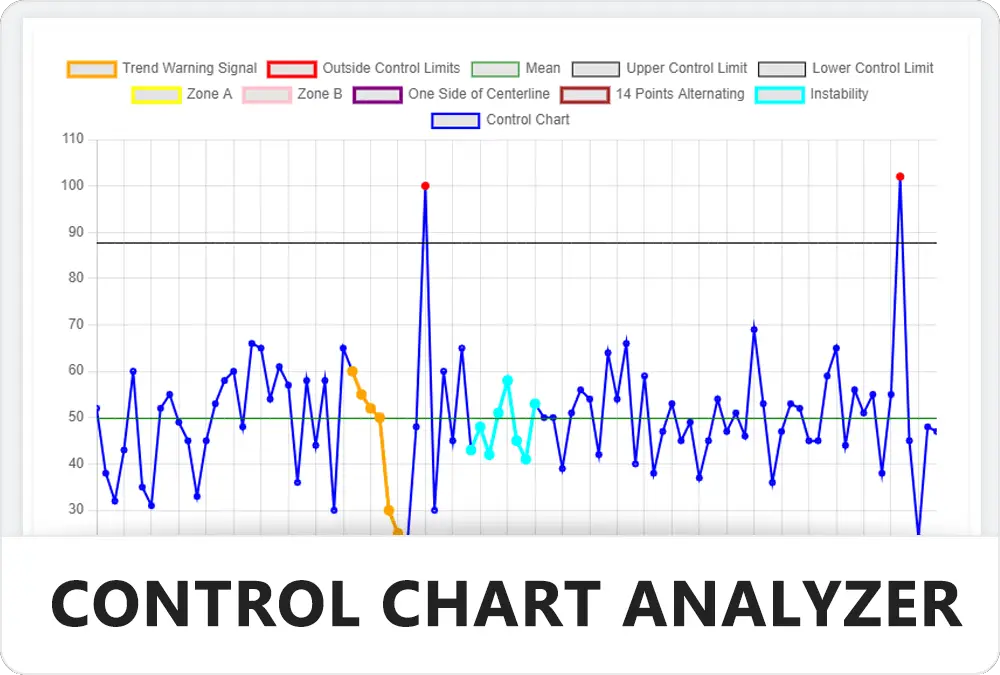
Now if we were to turn the Histogram 90-degree clock ways onto its side and separate the data points in the histograms into data points on something that looks like a line graph we would have something that looks like the below chart.

You can see most of the points have what is called common cause variation. However, the 4th data point is a special cause variation as it is outside of the upper control limit. This would indicate the process is not capable of stating within the process control limits set at +/- 3 standard deviations from the mean.
It is worth clarifying that the spec limits and the control limits are not the same, businesses aim to keep control limits within specification limits to meet customer requirements, ensure product quality, minimize costs and allow a margin of error in the event of process failures.
Cpk values range from 0 to 1, with higher values indicating improved process capability. A Cpk value of one indicates that the process is completely capable of meeting specifications, whereas a Cpk value less than one indicates that the process may not fully meet specifications and may need to be improved.
How CPK is Calculated and Interpreted
Cpk is calculated using the following formula:
Cpk = min[(USL – μ) / (3σ), (μ – LSL) / (3σ)] Where:
- USL: Upper Specification Limit, which represents the maximum acceptable value for a characteristic of interest.
- LSL: Lower Specification Limit, which represents the minimum acceptable value for a characteristic of interest.
- μ: Process Mean, which is the average of the process data.
- σ: Process Standard Deviation, which indicates the variability or spread of the process data.
Example of Process Capability Calculation
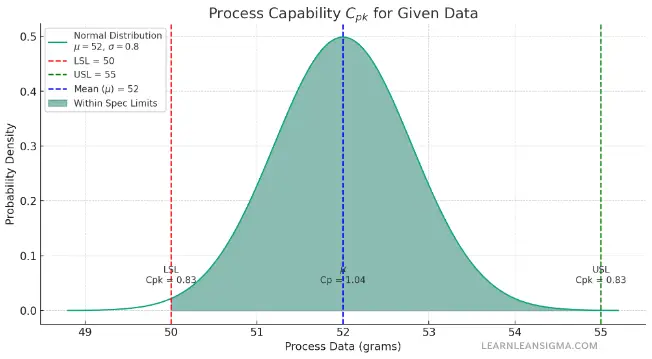
ChocoDelight specializes in producing chocolate bars. Customers have told the company that the weight of their chocolate bars should be between 50 and 55 grams to ensure consistent taste and satisfaction. They want to assess their production line’s process capability to ensure that the chocolate bars they produce meet these weight requirements.
Data for Process Capability Analysis:
- Upper Specification Limit (USL): 55 grams
- Lower Specification Limit (LSL): 50 grams
- Process Standard Deviation (σ): 0.8 grams
- Process Mean (Target): 52 grams
Calculate the Process Capability Index (Cp):
Cp = (USL – LSL) / (6 * σ) Cp = (55 – 50) / (6 * 0.8) Cp = 5 / 4.8 ≈ 1.04
Calculate the Process Capability Index with respect to the process mean (Cpk):
Cpk = min((USL – Mean) / (3 * σ), (Mean – LSL) / (3 * σ)) Cpk = min((55 – 52) / (3 * 0.8), (52 – 50) / (3 * 0.8)) Cpk = min(3 / 2.4, 2 / 2.4) Cpk = min(1.25, 0.83) ≈ 0.83
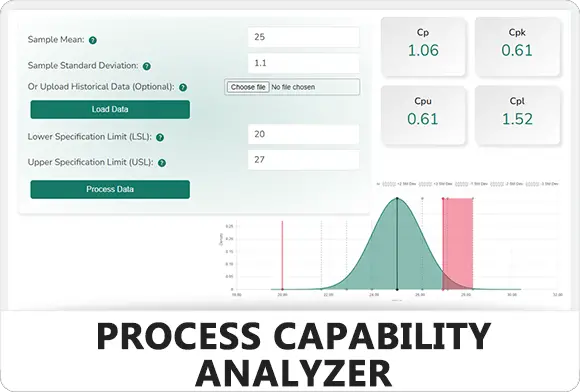
For simplicity, you can input the data into the calculator below to see the results.
Interpretation:
The process capability analysis for ChocoDelight’s chocolate bars reveals the following:
- Cp value is 1.04, indicating that the process is capable of producing within the specification limits but with some variability.
- Cpk value is 0.83, indicating that the process is not well-centered within the specification limits. It is slightly shifted towards the lower end.

Conclusion:
Based on the process capability analysis, ChocoDelight’s chocolate manufacturing process has some room for improvement. The process variability is causing some chocolate bars to fall closer to the lower weight limit. The company should focus on reducing process variability and centring the process mean closer to the target weight to ensure more consistent and satisfactory chocolate bars for their customers.
Visualize Your Data
Visualize your data with our Process Capability Visualiser tool to help you understand it better. This includes free to download reports outlining facts about the data giving you the power of Lean Six Sigma Black Belt Knowledge.
Get startedProcess Capability Index Calculator
Cp:
Cpk:
CP Feedback:
CPK Feedback:
Interpreting CPK Values
Cpk values are a critical measure for assessing the capability and performance of a process. These values range between from 0 and go on with no upper limit, but generally a process Cpk will be between 0 and 3, with 3 being and exceptionally good process capability. This can serve as a reliable indicator of a process's ability to meet customer requirements and specifications.
Interpreting Cpk Values:
- Cpk > 1: The process is highly capable and consistently meets specifications. A Cpk of 1.33 or higher is generally considered acceptable, while 1.67 or higher is preferred for critical applications.
- Cpk = 1: The process is marginally capable and might produce occasional non-conforming items.
- Cpk < 1: The process is not capable and is prone to generating a significant number of defects or non-conforming items.
Relationship to Process Capability and Performance:
Cpk values are not isolated metrics; they are deeply interconnected with the overall process capability and performance. A higher Cpk value indicates a process with less variability and fewer defects, resulting in improved performance. On the contrary, a lower Cpk suggests a less capable process, yielding more variability and defects.
Setting Cpk Targets:
Cpk targets vary based on industry, application, and specific customer requirements. For instance, the automotive and medical device sectors may have higher Cpk targets due to the critical nature of their products. Organizations should set appropriate Cpk targets to align with industry standards and customer expectations.
Actionable Insights:
Understanding Cpk values is not just theoretical; it's instrumental for continuous improvement. Organizations can use these values to identify areas requiring attention and take proactive steps to enhance process performance. By diligently tracking Cpk values over time, organizations can sustain quality, improve customer satisfaction, and drive value.
Understanding and interpreting Cpk values are crucial steps in assessing process capability and performance, setting industry-appropriate targets, and driving continuous improvement initiatives.
What is a good Cpk?
In our expert opinion, generally, where process capability (Cpk) scores at least a 1.5 this is a sign of a more than capable process with a margin of error in case of changes or some short-term unreliability on the process that can be addressed before the Cpk value falls below 1 and causes defect.
The aim should be to continue to improve process capability as much as possible to reduce the amount of variation as much as possible. This will be more important in some industries than others such as pharmaceuticals creating medicines where a variation in the amount of mgs in a product can be high risk compared to a variation by a drinks manufacturer in the number of millilitres of water in a bottle.
Check out some of our Process Capability Tools


Importance of Cpk in Statistical Process Control
The Process Capability Index (Cpk) is an important tool in Statistical Process Control (SPC) for assessing process performance and capability. It provides valuable insights into a process's stability, predictability, and quality, making it an important metric for quality professionals and process engineers.
Role of Cpk and Process Control Charts
Cpk is used to assess how well a process performs in comparison to specification limits. It aids in determining whether a process is capable of consistently meeting customer requirements. A higher Cpk value indicates a more capable process with less variability, which leads to fewer defects and improved process performance. Cpk enables organizations to objectively assess the performance of their processes, identify areas for improvement, and take proactive measures to improve process capability.
The link between Cpk and Process Control Charts
SPC makes extensive use of process control charts to monitor and control process performance over time. Cpk is closely related to process control charts because it provides a quantitative measure of process capability that can be used alongside control charts to assess process stability and predictability. Control charts monitor and plot process data over time, allowing organizations to detect and respond to process variations. Organizations can better understand process performance and capability by integrating Cpk values with control charts, identifying patterns, trends, or out-of-control signals, and taking timely corrective actions.
Using Cpk to Determine Process Stability and Predictability
Cpk values can indicate a process's stability and predictability. A high Cpk value indicates a stable and predictable process with little variability, producing consistent and conforming results. A low Cpk value, on the other hand, indicates a less stable process with higher variability, resulting in inconsistent and non-conforming outputs. Organizations can assess the stability and predictability of their processes, identify sources of variability, and take steps to improve process control and predictability by tracking Cpk values over time.
Impacts of Cpk on Product Quality, Customer Satisfaction, and Business Performance
Product quality, customer satisfaction, and overall business performance are all affected by Cpk. A higher Cpk value indicates a more capable process with fewer defects and higher product quality. Improved product quality leads to increased customer satisfaction because customers consistently receive products that meet their specifications. Customers who are satisfied are more likely to be loyal, repeat customers and may even refer the business to others, which improves business performance. A lower Cpk value, on the other hand, indicates a less capable process that produces more defects, resulting in lower product quality and customer dissatisfaction. This can lead to customer complaints, product returns, and potential loss of business, all of which have a negative impact on overall business performance.
Cpk is a vital tool in Statistical Process Control that assists organizations in evaluating process performance, stability, and capability. It is inextricably linked to process control charts, provides insights into process stability and predictability, and has direct implications for product quality, customer satisfaction, and business performance. Organizations can drive continuous improvement, improve process capability, and deliver high-quality products or services to meet customer expectations and achieve business success by understanding the importance of Cpk and utilizing it effectively.
Factors Affecting Cpk
Process variability, measurement error, equipment performance, and human factors can all have an impact on Cpk values. It is critical to identify and address the sources of process variability in order to improve Cpk values.
Factors that can impact Cpk Values
Process variability: Process variability is a significant factor that can influence Cpk values. High variability can result in lower Cpk values, indicating a less capable process. Machine settings, raw materials, environmental factors, and human factors can all contribute to process variability.
Measurement error: Measurement error can also impact Cpk values. If the measurement system used to assess process performance is inaccurate or imprecise, it can result in incorrect Cpk values.
Equipment performance: Equipment performance can impact Cpk values. If the equipment used to manufacture the product is not properly maintained or calibrated, it can lead to process variability and lower Cpk values.
Human factors: Human factors can have an effect on Cpk values. If the operators are not properly trained or if they perform their tasks inconsistently, it can lead to process variability and lower Cpk values.
Identifying and Addressing Sources of Process Variability
It is critical to identify and address the sources of process variability in order to improve Cpk values. Statistical process control (SPC), design of experiments (DOE), and root cause analysis (RCA) are all techniques that can help identify and address sources of process variability. SPC entails continuously monitoring the process and taking corrective actions as needed. DOE entails systematically varying process parameters in order to determine the optimal settings that result in the highest Cpk values. RCA entails determining the root cause of process variability and implementing corrective actions to eliminate the problem's source.
Techniques to Improve Cpk with Process Optimization and Control
Cpk can be improved using a variety of techniques such as process optimization and control. These are some examples:
Process automation: Process automation can help reduce variability and improve Cpk values. Human error can be eliminated by automating processes and ensuring consistent process performance.
Standardization of the process: Standardization of the process can help reduce variability and improve Cpk values. Organizations can ensure consistent process performance by establishing standard operating procedures (SOPs) and work instructions.
Process enhancement: Constantly improving the process can help reduce variability and increase Cpk values. Lean manufacturing, Six Sigma, and Total Quality Management (TQM) techniques can assist organizations in improving process performance and increasing Cpk values.
Limitations of Cpk
While Cpk is a widely used process capability index, there are some limitations and assumptions to be aware of when interpreting and applying it in real-world scenarios.
Limits and Assumptions of Cpk
Normal distribution assumption: Cpk assumes that the process is normally distributed, which may not always be the case. Process distributions can be skewed or non-normal in real-world scenarios, influencing Cpk values.
Symmetrical distribution assumption: Cpk assumes that the process distribution is symmetrical, which may not always be the case. Different Cpk values for the upper and lower specification limits can result from asymmetrical distributions.
Linear relationship between the process mean and specification limits: Cpk assumes that there is a linear relationship between the process mean and the specification limits. In some cases, this assumption may be incorrect, resulting in incorrect Cpk values.
Other Factors Beyond Cpk for a Comprehensive Process Assessment
While Cpk is an effective tool for assessing process capability, it is not the only factor to consider. Other factors, such as process stability, predictability, and control, should also be considered for a thorough process evaluation. Process stability refers to the process's consistency over time, whereas process predictability refers to the process's ability to meet specifications over time. The ability to maintain a stable process and prevent out-of-control situations is referred to as process control.
Challenges in Interpreting and Applying Cpk
It can be difficult to interpret and apply Cpk in real-world scenarios, especially when dealing with non-normal or asymmetrical distributions. In some cases, alternative process capability indices or non-parametric methods may be required to assess process performance. Furthermore, the impact of measurement error, equipment performance, and human factors on Cpk values must be considered.
While Cpk is a widely used process capability index, it has limitations and assumptions that should be considered when interpreting and applying it in real-world scenarios. Other factors such as process stability, predictability, and control should also be considered for a thorough process evaluation. It is critical to be aware of the potential difficulties in interpreting and applying Cpk in real-world scenarios and to consider alternative methods when necessary. By taking these factors into account, organizations can make informed decisions about process improvement and control, resulting in higher product quality and customer satisfaction.
Conclusion
Finally, the process capability index (Cpk) is a powerful tool for assessing a process's performance and capability. It is an important metric for quality control because it allows organizations to assess a process's ability to meet customer requirements and specifications. Cpk values provide a clear indication of process performance in comparison to specifications, making it easier to identify areas for improvement and optimization.
To monitor and maintain process stability and predictability, Cpk can be used in conjunction with other tools such as process control charts. Furthermore, organizations can improve Cpk values through process optimization and control by identifying and addressing sources of process variability.
However, it is critical to understand Cpk's limitations and assumptions as a process capability index. It is based on the assumption of a normal, symmetrical distribution and a linear relationship between the process mean and the specification limits. Other considerations for a comprehensive process assessment include process stability, predictability, and control.
Overall, organizations can improve their product quality, customer satisfaction, and business performance by understanding and utilizing Cpk. Organizations can maintain their competitive edge in the market and continue to meet and exceed customer expectations by continuously monitoring and optimizing processes.
References
- Wu, C.W., Pearn, W.L. and Kotz, S., 2009. An overview of theory and practice on process capability indices for quality assurance. International journal of production economics, 117(2), pp.338-359.
- Pearn, W.L. and Chen, K.S., 1999. Making decisions in assessing process capability index Cpk. Quality and reliability engineering international, 15(4), pp.321-326.
- Palmer, K. and Tsui, K.L., 1999. A review and interpretations of process capability indices. Annals of Operations Research, 87, pp.31-47.


