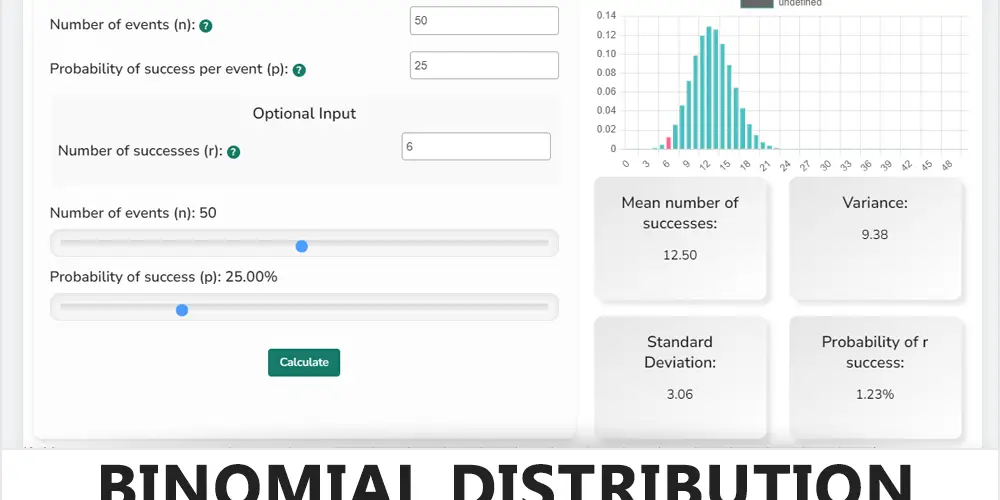
Binomial Distribution Calculator
The Binomial Distribution Calculator is an intuitive tool designed to simplify complex statistical analyses. Rooted in the principles of binomial distribution, it assesses the probability of observing a specific number of successes in a set of independent trials, each having the same likelihood of success. This calculator is pivotal for diverse sectors such as business forecasting, medical research, sports analytics, and quality assurance, to name a few. By inputting a few key parameters, users receive insights on the mean, variance, standard deviation, and the chance of a particular outcome. Accompanied by a visual histogram, the calculator not only offers numerical results but also a comprehensive graphical representation, making data interpretation straightforward and effective.
Binomial Distribution Calculator
Optional Input
Mean number of successes:
Variance:
Standard Deviation:
Probability of r success:
How to use the Binomial Distribution Calculator:
The Binomial Distribution Calculator allows you to compute various statistics related to binomial distributions, such as the mean, variance, standard deviation, and the probability of a certain number of successes.
How to Use
Number of Events (n):
- This represents the total number of trials or events.
- Input the desired number of events in the “Number of events (n)” field.
- Use the slider below the input field to adjust the value visually if desired.
Probability of Success per Event (p):
- This is the probability of success in a single trial.
- Input the probability value in the “Probability of success per event (p)” field. This can be a value between 0 and 1 (e.g., 0.5 for 50%).
- Alternatively, if you’re inputting the value as a percentage, the tool will auto-correct it. For example, entering 50 will be interpreted as 50% or 0.5.
- Use the slider below the input field to adjust the value visually if desired.
Number of Successes (r) – Optional:
- This is the desired number of successes.
- If you want to find out the probability of a specific number of successes, input the desired number in the “Number of successes (r)” field.
- If left blank, the calculator will skip computing the probability for a specific number of successes.
Calculate:
- After entering the required values, click on the “Calculate” button.
- The calculator will display the following statistics:
- Mean Number of Successes: The average number of successes for the given number of events and probability.
- Variance: A measure of the dispersion of the distribution.
- Standard Deviation: The average amount by which individual observations deviate from the mean.
- Probability of r Success: The probability of achieving the specified number of successes. This will be displayed only if the “Number of successes (r)” field is filled.
Visual Representation:
- The histogram on the right provides a visual representation of the probability distribution. Each bar represents the probability of a particular number of successes. If you specified a number of successes, that particular bar will be highlighted.
Binomial Distribution Calculator: Explanation
What is Binomial Distribution?
Binomial distribution is a specific probability distribution that describes the number of successes in a fixed number of independent Bernoulli trials. A Bernoulli trial is a random experiment where there are only two possible outcomes – success or failure. The key features of a binomial distribution are:
- The number of trials (or observations) is fixed.
- Each trial is independent of the others.
- There are only two possible outcomes for each trial, termed “success” and “failure.”
- The probability of success remains the same for each trial.
What is the Binomial Distribution Calculator?
The Binomial Distribution Calculator is a tool designed to compute various statistics related to binomial distributions. Specifically, it can determine:
- The mean (average number of successes)
- The variance (a measure of the dispersion or spread of the distribution)
- The standard deviation (the average amount by which individual observations deviate from the mean)
- The probability of achieving a specific number of successes in a given number of trials with a particular probability of success.
Uses of the Binomial Distribution Calculator:
Business: Companies can use it to predict the likelihood of a specific number of product sales given a certain success rate from past data.
Healthcare: Researchers can predict the number of patients likely to show a particular treatment’s positive effects based on previous success rates.
Sports: Coaches can estimate the probability of a player making a certain number of shots given their past shooting percentage.
Quality Control: Manufacturers can determine the probability of a certain number of defective items in a batch based on known defect rates.
Finance: Analysts can use it to determine the probability of a certain number of stocks moving up or down based on past trends.
Education: Teachers can predict how many students might pass or fail an exam based on previous exam results.
In essence, the Binomial Distribution Calculator is a versatile tool that assists in making informed decisions and predictions in various fields where there are two distinct outcomes. It provides both numerical results and a visual representation (histogram) to help users interpret the data.
Useful Templates
Histogram Template
Histogram Excel Template Download our Free Microsoft Excel Histogram template to easily analyse and interpret your continuous data. All you…
Data Collection Plan Template
Data Collection Plan Excel Template Our Data Collection Plan Excel Template is a simple tool that is designed to help…
Template: Risk Assessment Matrix
Risk Assessment Matrix Excel Template Download our free Risk Assessment Matrix Template in Excel format to effectively manage and assess…


