Process Flow Diagram Template
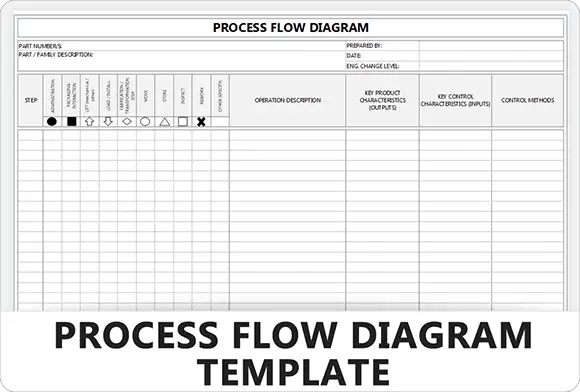
This Process Flow Diagram template maps manufacturing steps sequentially. It categorizes operations with specific symbols and defines key product characteristics and control methods to ensure consistent quality standards.
★★★★★
4.4 845 reviews ↓ 33K + Downloads
↻ Updated February 2026

About this Template
The Process Flow Diagram (PFD) is a visual representation of the sequence of steps, decisions, and inputs required to complete a process. It serves as the "roadmap" for your operation, identifying exactly how inputs are transformed into outputs.
Unlike a simple checklist, a PFD utilizes standardized symbols (such as diamonds for decisions and rectangles for process steps) to map logical relationships and potential loops. This makes it an essential tool for identifying Non-Value-Added (NVA) steps and bottlenecks during the Define and Measure phases of Six Sigma.
Use this template to standardize your work instructions, train new employees, or prepare for a Value Stream Mapping (VSM) exercise.
Pro Tip: Always map the process as it actually happens, not how it is supposed to happen. Walk the "Gemba" (workplace) and observe the operators directly to capture the hidden factory.
Standardized Symbols
Uses universally recognized ANSI symbols (Ovals, Rectangles, Diamonds) so your map is readable by anyone, anywhere.
Bottleneck Identification
Visualizes[Image of cross functional flowchart example] where work piles up or loops back, allowing you to target inefficiencies quickly.
Decision Logic
Clearly maps "If/Then" scenarios with decision diamonds, reducing ambiguity in operator instructions.
Value Analysis
Helps distinguish between value-added steps and non-value-added waste, setting the stage for Lean improvements.
Perfect For
Standard Work Process Mapping Lean Six Sigma Training Docs VSM
Process Symbol Reference
Adhere to standard ANSI/ISO symbols to ensure your map is universally readable.
Standard Symbols
- TerminatorStart or End of the process flow.
- Process StepA specific action, task, or operation.
- DecisionA branch point (Yes/No or Pass/Fail).
- Predefined ProcessA subroutine defined elsewhere.
- Delay / WaitA waiting period or temporary storage.
Inputs & Connectors
- Flow LineIndicates the sequence of steps.
- ConnectorJumps to another point on the same page.
- DocumentA report, email, or printed output.
- Data / InputGeneral Input/Output (Parallelogram).
- DatabaseInformation stored electronically.
FREE
Join the 28-Day Lean Challenge
Take your skills to the next level. Join 15,000+ practitioners and get exclusive tools delivered to your inbox.
Daily Lessons 5 Bonus Templates PDF Guides
Start the Challenge
No spam. Unsubscribe anytime.
How to Map a Process Flow
Create a visual representation of your workflow to identify bottlenecks, redundancies, and opportunities for improvement.
Step 01
Define the Boundaries
Before drawing symbols, clearly define where the process begins and ends. This prevents "scope creep" and ensures the team focuses on the correct segment of work.
- Start Point: The trigger (e.g., "Customer Order Received").
- End Point: The output (e.g., "Product Shipped").
- Inputs: What materials or data are required to start?
Tip:
If the process is too large, break it down into sub-processes.
Step 02
Map the Sequence
List the steps in sequential order. Use standard symbols to distinguish between actions, decisions, and waiting periods.
- Rectangle: Process Step / Activity.
- Diamond: Decision Point (Yes/No).
- D-Shape: Delay or Wait time.
- Arrow: Direction of flow.
Standard:
Stick to ANSI/ISO symbols so your map is universally readable.
Step 03
Verify the Reality
Don't map what you think happens or what the SOP says. Map what actually happens. This requires walking the process (Gemba Walk) and interviewing operators.
- Observation: Watch the process in real-time.
- Hidden Factory: Look for undocumented workarounds or rework loops.
- Consensus: Ensure everyone agrees the map is accurate.
Step 04
Analyze for Value
Use the completed map to identify inefficiencies. Color-code steps to highlight Non-Value Added (NVA) activities that can be eliminated.
- Value Added (Green): Changes the product in a way the customer pays for.
- Non-Value Added (Red): Waste (e.g., waiting, moving, reworking).
- NVA-Necessary (Yellow): Regulatory or business requirements (e.g., inspections).
Next Level:
Transition this map into a Value Stream Map (VSM) to add time data.
Process Mapping FAQ
Common Questions
What is the difference between a PFD and a Value Stream Map?
A Process Flow Diagram (PFD) focuses on the logical sequence of steps (the "how"). It identifies complexity, redundancy, and decision points.
A Value Stream Map (VSM) includes the PFD but adds data layers (Cycle Time, Inventory, Information Flow) to visualize the flow of value vs. waste. You typically start with a PFD before advancing to a VSM.
Why must I use standard shapes? Can't I just use boxes?
Standardization is key to clarity. Using only boxes hides logic. Specific shapes communicate specific actions instantly without needing to read the text.
What is a "Swimlane" diagram?
A Swimlane (or Cross-Functional) map organizes steps into horizontal or vertical lanes based on who performs the task. This highlights "handoffs" between departments, which are common failure points.
Should I map the "Current State" or "Future State"?
Always start with the Current State. You must understand the process as it actually runs today (including all the rework loops and quick fixes) before you can design an optimized Future State.
Designing a Future State without a validated Current State map often leads to solutions that fail because they ignore the reality of the "Hidden Factory."
How detailed should my map be?
It depends on the audience. A Level 1 map (High Level) might have 5-7 blocks for executives. A Level 2 map drills down for managers. A Level 3 map is for operators and includes every button press.
Related Templates
View Library
TemplateValue Add Analysis Template
4.7
11K +
Six SigmaData Collection Plan Template
3.7
8K +
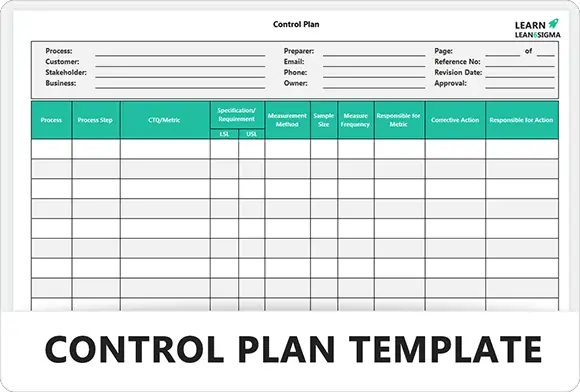
Risk ManagementControl Plan Template
4.3
4K +
Six SigmaCommunication Plan Template
4.4
7K +
Root Cause Analysis5 Whys Template
4.2
33K +
TEMPLATEOEE Calculator Template
4.0
1.1K +
TemplateGantt Chart Template
4.1
1K +
Six SigmaIs/Is Not Template
4
4K +
TemplateLessons Learned Template
3.8
2.5K +
Six SigmaDMAIC Project Report Template
4.7
120K +
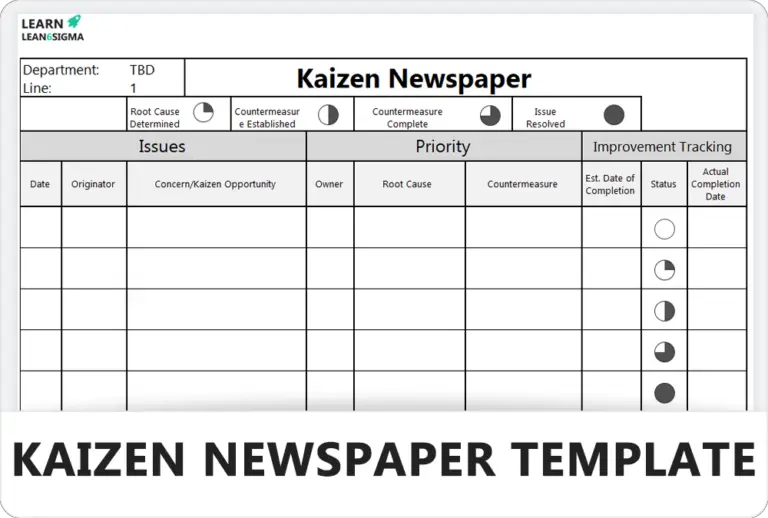
TemplateKaizen Newspaper Template
4.7
13K +
Root Cause AnalysisA3 Problem Solving Template
4.7
53K +
TemplateSWOT Analysis Template
3.8
11K +
Six SigmaProject Charter Template
4.6
22k +
Risk ManagementFMEA Template for Risk Analysis and Failure Prevention
4.8
85k +
Risk ManagementRisk Assessment Template
4.4
14K +
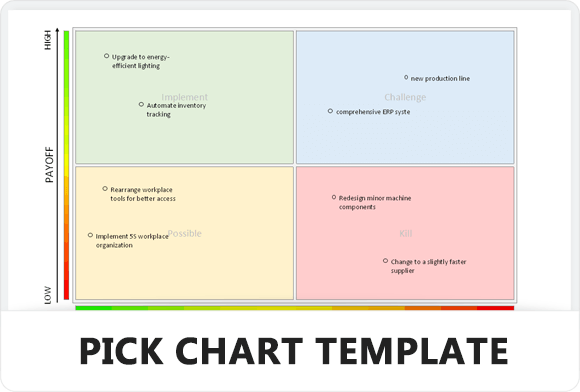
PrioritisationPICK Chart Template
4.0
10K +
Six SigmaSIPOC Template
3.9
4K +
5S5S Audit and Action Template
4.9
45K +
Six SigmaAction List Template
3.7
1K +
5S5S Audit Template for Workplace Organisation & Sustainment
4.4
23K +
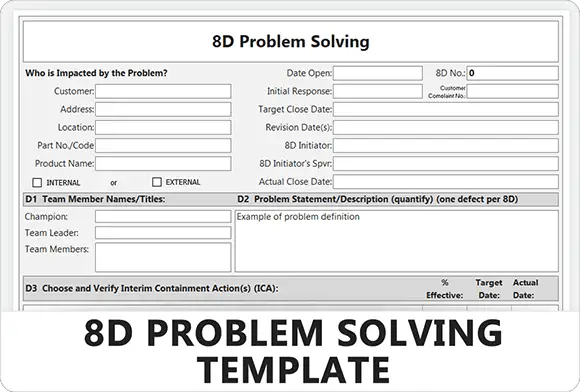
Root Cause Analysis8D Problem Solving Template
4.3
19K +
5S5S Red Tag Template
4.8
8K +
PrioritisationImpact and Effort Matrix Template
3.6
5K +
Free for Personal Use
Free
Instant Download • No CC Required
Download Excel Secure SSL 256-bit Encrypted
What's Included
Free Template
Process Flow Diagram Template