Do you want to solve business problems in an efficient manner? If this is the case, you should think about using Ishikawa Diagrams. Ishikawa Diagrams, also known as fishbone diagrams or cause-and-effect diagrams, are a visual tool that can help identify the root causes of a problem. As a result, they are an ideal solution for businesses looking to improve their processes and reduce errors.
We’ll look at how Ishikawa Diagrams can be used to solve business problems in this post. We’ll look at the anatomy of an Ishikawa Diagram and show you how to make one step by step. We’ll also look at real-world examples of business problems solved with Ishikawa Diagrams and the benefits gained by doing so. Finally, we’ll go over best practises for using Ishikawa Diagrams and how to avoid common pitfalls.
Whether you’re new to Ishikawa Diagrams or want to improve your problem-solving skills, this post will walk you through how to use this powerful tool to solve business problems.
Table of Contents
What is an Ishikawa Diagram
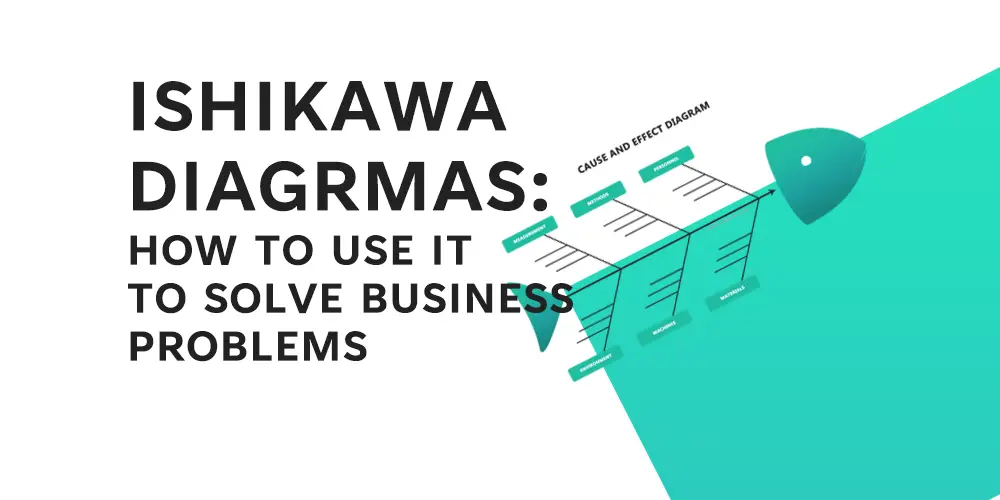
Because of its appearance, the Ishikawa Diagram is also known as the fishbone diagram after its creator, Kaoru Ishikawa. The diagram is organised with a central spine and several branches that resemble fish bones. Each branch represents a possible cause category that contributes to the problem under consideration.
Because it is a versatile and widely used tool in problem solving and process improvement, an Ishikawa diagram is known by many different names. Here are some brief explanations for the various names:
Fishbone diagram: This name comes from the visual appearance of the diagram, which looks like a fish skeleton with the problem or effect at the head and the causes branching out like the bones of the fish.
Cause-and-effect diagram: This name reflects the diagram’s purpose, which is to aid in the identification of the root causes of a problem by mapping out the various factors that contribute to it. The diagram depicts the relationships between the causes and the effects, making it easier to determine where to focus improvement efforts.
Herringbone diagram: This is another name for the diagram’s appearance. The diagram’s branches resemble the bones of a herring, a type of fish.
While the names may be used interchangeably, they all refer to the same basic problem-solving and process-improvement tool.

An Ishikawa Diagram has six main branches, which are as follows:
- Personnel – This branch includes all human-related factors that may have an impact on the problem under consideration, such as training, communication, and teamwork.
- Process – This branch includes all of the steps and procedures involved in the process or activity, as well as the equipment, materials, and workflow.
- Machines – This branch includes all the physical equipment and machinery used in the process, including tools, machines, and technology.
- Materials – The raw materials and other inputs used in the process, such as supplies, ingredients, and components, are the focus of this branch.
- Environment – This branch includes all environmental factors that may affect the process, such as temperature, humidity, lighting, and noise.
- Measurement – This branch includes all metrics and measurements used to evaluate the process, such as quality standards, performance indicators, and statistical analysis.
Each of these branches is used to identify potential causes that may be contributing to the problem under investigation. For example, if a decrease in product quality is the issue, the Ishikawa Diagram can be used to identify the various factors that could be causing this problem, such as a lack of employee training, faulty equipment, or low-quality materials. The branches are used to identify as many potential causes as possible, which can then be further evaluated to determine the underlying cause of the problem.
The Ishikawa Diagram assists teams in gaining a better understanding of the problem being analysed and developing targeted solutions to address the root cause by identifying potential causes and organising them in a clear and concise manner.
How to Create an Ishikawa Diagram
Creating an Ishikawa Diagram is a simple process that begins with identifying the problem and breaking it down into its component parts. Here’s a step-by-step tutorial for making an Ishikawa Diagram:
- Step 1: Identify the problem and write it in a box at the top of the diagram.
- Step 2: To represent the main spine of the fishbone diagram, draw a horizontal arrow pointing to the problem box.
- Step 3: Draw a diagonal arrow for each of the diagram’s six main branches (People, Process, Equipment, Materials, Environment, and Measurement). Label each arrow with the name of the corresponding branch.
- Step 4: Determine the possible causes of the problem and document them on the appropriate branch. Create as many causes as you can and add them to the diagram.
- Step 5: If necessary, divide each cause into smaller sub-causes. Include these sub-causes in your diagram as well.
- Step 6: Determine the root cause of the problem by evaluating potential causes and sub-causes. The root cause is the underlying issue that is causing the problem being investigated.
- Step 7: Create and implement solutions to the root cause.
In addition to drawing an Ishikawa Diagram by hand, several software tools are available to help you create and collaborate on these diagrams. Among the most popular software tools are:
SmartDraw: This programme provides a variety of templates and tools for creating professional-looking Ishikawa Diagrams.
Lucidchart: This cloud-based software enables teams to work together in real-time to create Ishikawa Diagrams.
Creately: For creating Ishikawa Diagrams, this tool provides a variety of templates and customization options.
Creating Ishikawa Diagrams with software tools can save time and streamline the process of collaborating with team members. These tools also make it simple to share and export the diagram in a variety of formats, making it easier to include in presentations and reports.
Using Ishikawa Diagrams in Problem-Solving
Ishikawa Diagrams are a powerful problem-solving tool that can be used in root cause analysis. Teams can analyse the causes and develop solutions to address the root cause by identifying the various factors that contribute to a problem.
The process of determining the underlying cause of a problem rather than just addressing its symptoms is known as root cause analysis. This approach assists teams in developing more effective and long-term problem solutions.
To use an Ishikawa Diagram in root cause analysis, teams must first identify the problem and draw a fishbone diagram. The diagram’s six main branches (Personnel, Process, Machine, Materials, Environment, and Measurement) are used to identify potential problem causes. Teams can analyse the root cause by brainstorming and organizing these causes on the diagram.
Teams can use the “five whys” technique in addition to an Ishikawa Diagram to identify the root cause of a problem. The five whys technique is a method of drilling down into the root cause of a problem by asking “why” five times. The goal is for the team to keep asking “why” until they find the underlying root cause of the problem.
For example, if the issue is a product delivery delay, the five whys technique could be used as follows:
- Why was the product delivery delayed? – Because the shipment was sent to the wrong address.
- Why was it sent to the wrong address? – Because the shipping label was incorrect.
- Why was the label incorrect? – Because the person who prepared it didn’t check the address.
- Why didn’t they check the address? – Because they were in a rush to finish the task.
- Why were they in a rush? – Because they were given too many tasks to complete in a short amount of time.
In this example, the root cause of the product delivery delay is that the worker was assigned too many tasks to complete in a short period of time. By identifying the root cause, the team can develop solutions to the problem, such as allocating more time for tasks or more effectively delegating responsibilities.
To Summarize here is an overview of how Ishikawa Diagrams are used in root cause analysis follows:
Step 1: Brainstorm potential causes for each branch and write them on the diagram’s appropriate branch.
Step 2: Examine each possible cause to see if it is the root cause or a symptom of the problem.
Step 3: Use 5 Whys Analysis to ask “why” five times for each potential root cause identified to determine the underlying cause of the problem. Check out our 5 Whys Analysis Template to support this
Step 4: Once the root cause has been identified, develop and implement solutions to address it.
Here is an example of how a complete Ishikawa Diagram may look with potential problems identified on it.

To summarise, Ishikawa Diagrams are an effective problem-solving tool that can be combined with the five whys technique to identify the root cause of a problem. Teams can develop more effective and long-term solutions to improve their processes and operations by analysing potential causes and asking “why” to drill down into the underlying issue.
Examples of Business Problems Solved with Ishikawa Diagrams
Ishikawa Diagrams, also known as fishbone diagrams, have been used to solve a wide range of business problems. Here are some real-world examples of business problems solved with Ishikawa Diagrams:
Quality control issues in a manufacturing plant
A manufacturing plant was experiencing quality control issues with their products. The problem was identified using an Ishikawa Diagram, which helped the team to identify the potential causes of the problem. The diagram revealed that the issues were caused by a lack of training among the employees, poor machine maintenance, and inadequate raw materials. By addressing these issues, the plant was able to improve the quality of its products and reduce waste.
A call centre has a high employee turnover rate.
A call center’s ability to provide quality customer service was being hampered by high employee turnover. An Ishikawa Diagram was used to identify the problem, which assisted the team in determining the potential causes of the high turnover rate. According to the diagram, the problems were caused by low employee morale, insufficient training, and a lack of career development opportunities. The call centre was able to improve employee satisfaction and retention rates by addressing these issues.
Inventory management in a retail store is inefficient.
A retail store’s inventory management process was inefficient, resulting in excess inventory and stockouts. An Ishikawa Diagram was used to identify the problem, which assisted the team in determining the potential causes of the inefficiencies. According to the diagram, the problems were caused by inaccurate demand forecasting, insufficient inventory tracking, and poor communication among the store’s departments. The store was able to improve its inventory management process, reduce excess inventory, and prevent stockouts by addressing these issues.
The Ishikawa Diagram was used as a problem-solving tool in each of these examples to identify potential causes of the problem. The diagram enabled the teams to brainstorm and organise the various factors that could be contributing to the problem, allowing them to drill down to the root cause. The teams were able to implement more effective and long-term solutions to improve their processes and operations by addressing the root cause.
The advantages of using Ishikawa Diagrams in these scenarios include improved quality control, reduced waste, increased employee retention and satisfaction, and increased inventory management efficiency. The diagram enabled the teams to take a structured approach to problem-solving, allowing them to identify the root cause of the problem and develop more effective solutions.
Best Practice for Ishikawa Diagrams
Ishikawa Diagrams are a powerful problem-solving tool, but they must be used correctly to produce the desired results. Some best practises for using Ishikawa Diagrams in problem-solving processes are as follows:
- Clearly define the problem: Before you create an Ishikawa Diagram, you must first define the problem you are attempting to solve. This will aid your concentration and ensure that your diagram is relevant and effective.
- Involve a diverse team: Ishikawa Diagrams work best when used in a group setting. To ensure a well-rounded perspective, try to include a diverse group of people from various departments or areas of expertise.
- Brainstorm potential causes: Encourage team members to brainstorm all potential causes of the problem when creating the diagram. This will assist you in identifying all potential root causes and ensuring that your solutions are all-inclusive.
- Use clear and concise language: When labelling the branches of the diagram, use clear and concise language to ensure that everyone understands the meaning. Avoid using jargon or abbreviations that may be confusing to some team members.
- Prioritize potential causes: After identifying all potential causes, prioritise them based on their likelihood of contributing to the problem. This will allow you to concentrate your efforts on the most pressing root causes.
- Verify the root cause: Before implementing any solutions, test your hypothesis to determine the root cause of the problem. This will help you ensure that you are treating the underlying cause of the problem rather than just the symptoms.
Avoiding Common Mistakes When Using Ishikawa Diagrams
While Ishikawa Diagrams can be a useful problem-solving tool, there are some common errors that teams can make when creating and using them. Here are some errors to avoid:
- Jumping to conclusions: It is critical to avoid jumping to conclusions before identifying and evaluating all potential causes. Rushing to solutions without fully comprehending the underlying cause of the problem can result in ineffective and costly solutions.
- Excessive diagram complexity: Keep the diagram simple and focused on the problem at hand. Overcomplicating the diagram with too many branches or irrelevant information can make determining the true root cause of the problem difficult.
- Ignoring other sources of information: While Ishikawa Diagrams are a powerful tool, they should not be used as the sole source of information in problem-solving processes. Other data sources to consider include customer feedback, process data, and employee input.
Teams can effectively use Ishikawa Diagrams to identify and address the root causes of business problems by adhering to these best practises and avoiding common pitfalls.
Conclusion
Finally, Ishikawa Diagrams are a useful tool for solving business problems and determining the root causes of problems. Teams can effectively use Ishikawa Diagrams to find comprehensive solutions by following best practices such as clearly defining the problem, involving a diverse team, brainstorming potential causes, and prioritising root causes.
It’s critical to remember that Ishikawa diagrams should be used in conjunction with other sources of information to ensure a well-rounded approach to problem-solving. Teams can effectively leverage the power of Ishikawa diagrams in their problem-solving processes by avoiding common mistakes such as overcomplicating the diagram and jumping to conclusions.
Finally, using Ishikawa Diagrams to solve business problems can result in better processes, higher customer satisfaction, and a more efficient organisation. Teams can achieve greater success and propel their businesses forward by mastering this powerful tool.
References
- Ilie, G. and Ciocoiu, C.N., 2010. Application of fishbone diagram to determine the risk of an event with multiple causes. Management research and practice, 2(1), pp.1-20.
- Radziwill, N., 2017. Creating ishikawa (fishbone) diagrams with R. Software Quality Professional, 20(1), pp.47-48.
