Gantt charts are an effective project management tool that can help organizations and individuals plan and schedule their projects more effectively. Gantt charts, despite their effectiveness, are frequently overlooked or underutilized.
We will look at the functionality, and benefits of Gantt charts in this blog post, as well as why they are an underutilised tool for helping you take control of your projects and achieve greater success. Gantt charts are a simple yet effective solution to the problem of ineffective project management because they provide a clear visual representation of a project’s tasks and schedule. This blog post will give you a thorough overview of Gantt charts and the benefits they provide if you’re looking for a more efficient way to manage your projects.
Looking for a Free Gantt Chart Template? Find ours here
Table of Contents
What are Gantt Charts and how do they Work?

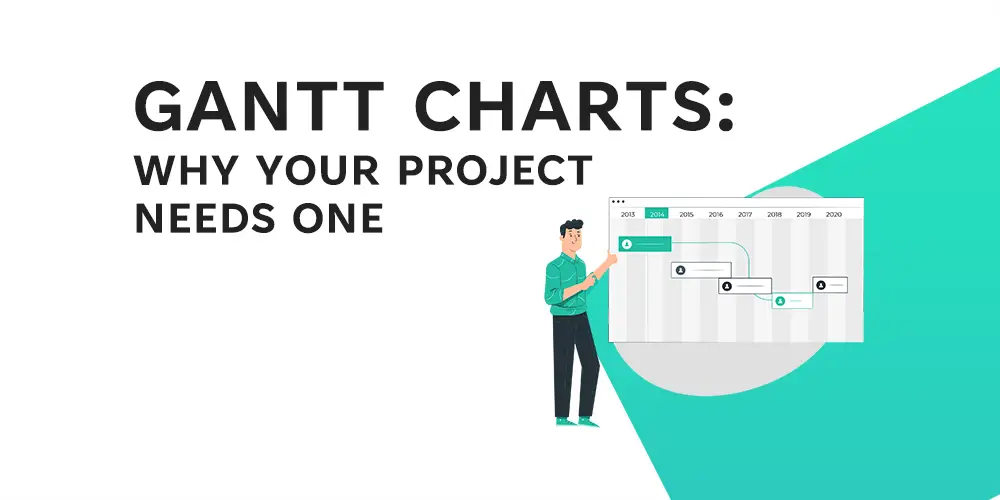
Gantt charts are a type of project management tool that can be used to plan and schedule projects. They are graphical representations of tasks or activities in a project, typically shown on a horizontal timescale, that help project managers and team members visualise the project’s progress and status.
The Gantt chart is made up of a series of horizontal bars that represent the project’s tasks or activities. Each bar represents the duration of the task or activity and is placed on a timescale, typically on the horizontal axis. A vertical line on the bar indicates the start and end date of each task. Dependencies between tasks are represented by arrows connecting the dependent tasks’ bars. Gantt charts also include a key or legend that explains the meaning of the chart’s various colours and symbols.
Gantt charts are used to plan and schedule projects by breaking them down into individual tasks and activities and organising them logically. Gantt charts can be used by project managers to identify task dependencies, allocate resources, and track progress. Gantt charts are also useful for setting deadlines, identifying potential problems and delays, and communicating project information to stakeholders.
Components of a Gantt Chart
A Gantt Chart usually consisted of the following key components:
Tasks or activities: The horizontal bars on the chart represent specific tasks or activities that must be completed as part of the project. The length of the bar corresponds to the task’s duration, and the position of the bar on the chart represents the task’s start and end dates. The task’s name is usually written next to the bar.
Timescale: This is typically represented on the horizontal axis and shows the duration of the project as well as the time frame for the tasks. Depending on the size and complexity of the project, the timescale can be set to any desired time frame, such as days, weeks, or months. The timescale aids in providing a clear picture of the project timeline and how tasks are to be completed.
Start and end dates: Represented by vertical lines on the bar, they indicate when a task or activity begins and when it is expected to be completed. The beginning of the bar represents the start date, and the ending of the bar represents the end date. This information contributes to a clear understanding of the project timeline and task duration.
Dependencies: These are represented by arrows connecting the bars of the dependent tasks. This depicts the relationship between various tasks and how they are interdependent. If task A must be completed before task B can begin, an arrow would connect the task A and task B bars. This aids in identifying and managing task dependencies, which is necessary for effective project planning and scheduling.
Key or legend: Explains the meaning of the chart’s various colours and symbols, as well as provides additional context and information about the tasks and activities. The key or legend may contain information such as the meaning of different coloured bars, symbols used to indicate task status, or different types of tasks. This aids in providing a clear understanding of the project and task progress.

Click here to download a Gantt Chart template
How are Gantt Charts used to Plan and Schedule Projects?
Gantt charts are used to plan and schedule projects by breaking them down into individual tasks and activities and organising them logically. Gantt charts are commonly used to plan and schedule projects in the following ways:
Identifying task dependencies: Gantt charts make it simple to identify task dependencies by connecting the bars of the dependent tasks with arrows. This ensures that tasks are completed in the correct sequence and that resources are allocated appropriately.
Allocating resources: Gantt charts can be used to allocate resources such as personnel, equipment, and materials to specific tasks. This ensures that resources are used efficiently and that the project remains on track.
Tracking progress: Gantt charts make it easy to track the progress of a project by showing the status of each task in the form of a bar. The length of the bar represents the task’s duration, and the position of the bar on the chart represents the task’s start and end dates.
Setting deadlines: Gantt charts can be used to set deadlines for individual tasks and for the overall project. This contributes to the project staying on track and tasks being completed on time.
Identifying issues and delays: By displaying the progress of each task and the dependencies between tasks, Gantt charts make it simple to identify potential issues and delays. This ensures that problems are addressed quickly and that the project remains on track.
Stakeholder communication: Gantt charts can be used to communicate project information to stakeholders such as team members, clients, and management. This helps to ensure that everyone involved in the project is aware of the project’s progress and status.
Benefits of using Gantt Charts
Project Visibility and Communication
Improved project visibility and communication: One of the primary advantages of using Gantt charts is that they improve project visibility and communication. Gantt charts make it simple to understand the status of individual tasks and the progress of a project, allowing for better communication among team members and stakeholders. This helps to ensure that everyone involved in the project is aware of the project’s progress and status, and that any issues or delays are addressed as soon as possible.

Increased Efficiency and Productivity
Increased efficiency and productivity: By breaking down a project into individual tasks and organizing them in a logical sequence, Gantt charts help to increase efficiency and productivity. This ensures that tasks are completed in the correct sequence and that resources are allocated appropriately. Gantt charts also make it simple to track the progress of a project, which aids in keeping the project on track and tasks completed on time.
Better Risk Management and Resource Allocation
Better risk management and resource allocation: Gantt charts can be used to identify potential risks and allocate resources such as personnel, equipment, and materials to specific tasks. This aids in risk management and ensures that resources are used efficiently. Gantt charts also make it simple to identify task dependencies, which aids in task management, which is critical for effective project planning and scheduling.
Enhanced Collaboration and Team Coordination

Enhanced collaboration and team coordination: Gantt charts can be used to communicate project information to stakeholders such as team members, clients, and management. This helps to ensure that everyone involved in the project is aware of the project’s progress and status. Gantt charts also make it simple for team members to collaborate and coordinate their efforts, which aids in completing tasks on time and keeping the project on track.
Ultimately, Gantt Charts are a valuable and effective tool for project planning and scheduling. They contribute to increased project visibility and communication, increased efficiency and productivity, risk management and resource allocation, and improved collaboration and team coordination. It is a tool that is frequently undervalued and overlooked due to its benefits, but it is an essential tool for any project manager or team leader looking to improve their project management process.
How to create and use a Gantt chart
A step-by-step guide to creating a Gantt chart
Identify the tasks and activities: Begin by making a list of all the tasks and activities that must be completed for your project. This will help you understand what needs to be done and when.
Determine the time required for each task: Each task should be assigned a time frame in the form of days, weeks, or months. This will help you understand how long it will take to complete each task.
Set the beginning and ending dates: Determine the start and end dates for each task and ensure that they are consistent with the overall project schedule.
Identify dependencies: Determine which tasks are dependent on the completion of others and represent them on the chart with arrows.
Make the chart: To make the chart, use Gantt chart software or a template. Gantt chart functionality is built into many project management tools, or you can use a free template.
Add the tasks and activities: Add the tasks and activities to the chart, along with their duration, start, and end dates, and dependencies.
Customize the chart: You can make the chart more visually appealing and informative by adding colours, labels, and other details.
Track progress: Once the chart is finished, use it to track progress and make changes as needed.
Explain the graph: Share the chart with your team and stakeholders to keep them updated on the status of the project.
Update the chart: Regularly update the chart as the project progresses, to ensure that it always reflects the most current status of the project.
Tips for using Gantt charts effectively
Keep it simple: A Gantt chart should be simple to read and understand. Avoid adding too much information or making it too cluttered.
Be realistic: When establishing start and end dates, ensure that they are both realistic and achievable. Avoid setting unrealistic deadlines that will only lead to disappointment.
Use dependencies: Use dependencies to show how tasks are related and dependent on each other. This will assist you in understanding the critical path of the project and making necessary adjustments.
Track your progress on a regular basis: Regularly update the chart with the current status of each task. This will allow you to identify any problems early on and make adjustments as needed.
Communicate with your team as follows: Share the chart with your team and stakeholders to keep them updated on the status of the project. Encourage them to provide feedback and make improvements.
Use software or templates: There are numerous software and templates available to help you easily create and manage Gantt charts. These can help you save time and effort while also making the process more efficient.
Be adaptable: Be willing to make changes as the project progresses. Things don’t always go as planned, so be prepared to adjust the chart accordingly.
Highlight critical tasks: Use colours or labels to highlight critical tasks, to make sure that these get the attention they need to be completed on time.
Common mistakes to avoid when using Gantt charts
Not keeping the chart up to date: It is critical for effective project management to keep the chart up to date with the current status of tasks. Failure to keep the chart up to date can result in confusion and delays.
Setting unattainable deadlines: Setting unattainable deadlines can lead to disappointment and frustration. Set realistic start and end dates for tasks and adjust them as necessary.
Failure to use dependencies: Failure to use dependencies can make it difficult to understand the critical path of the project and make necessary adjustments.
Not communicating with team members and stakeholders: Gantt charts are a great tool for communication, but they are not effective if they are not shared with the team and stakeholders.
Excessive chart complexity: A Gantt chart should be simple to read and understand. Avoid overcrowding or making it too cluttered, as this can make it difficult to interpret.
Not taking into account resource constraints: Failure to consider resource constraints such as personnel or equipment availability can result in delays and inefficiencies.
Not being adaptable: It is critical to be prepared to make changes as the project progresses. Things don’t always go as planned, so be prepared to adjust the chart accordingly.
Failure to highlight critical tasks: Failure to use colours or labels to highlight critical tasks can make it difficult to focus on and complete the most important tasks on time.
Conclusion
In conclusion, Gantt charts are an effective project management tool that can help organisations and individuals plan and schedule their projects more effectively. They provide a clear visual representation of the tasks and schedule of a project, making it simple to identify task dependencies, allocate resources, track progress, set deadlines, identify potential problems and delays, and communicate project information to stakeholders. Gantt charts improve project management by breaking projects down into individual tasks and organising them logically. If you want to manage your projects more efficiently, Gantt charts are a simple yet effective solution.


