Have you ever found yourself lost in a sea of data while working on a Lean Six Sigma project, wondering how to make sense of it all? You’re not alone. In the complex realm of Lean Six Sigma, data-driven decision-making is at the core of optimizing business processes. But how can you separate the signal from the noise? Enter the P-Value, a pivotal statistical measure that can serve as your North Star in hypothesis testing and data analysis.
Understanding its role can mean the difference between a project’s success or failure. In this blog post, we will delve deep into the role of P-Value within Lean Six Sigma methodology. You’ll learn where it fits in the DMAIC framework, how it impacts each phase, and the common pitfalls to avoid. Whether you’re a seasoned practitioner or a Lean Six Sigma novice, this guide will enhance your toolkit for continuous improvement.
Table of Contents
What is P-Value?
Definition of P-Value
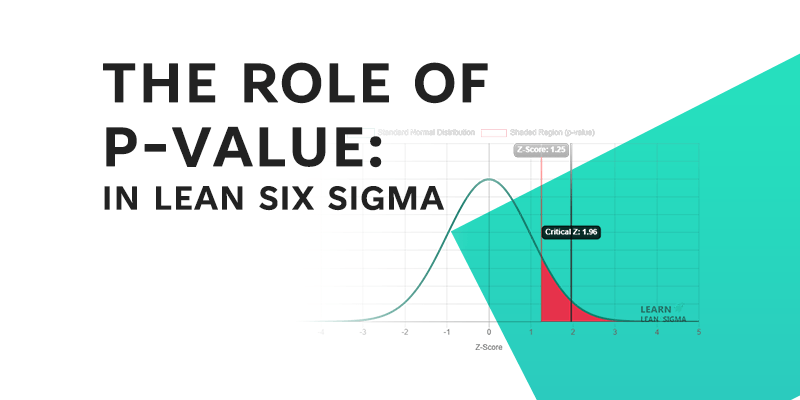
The P-Value, short for “probability value,” is a fundamental concept in statistics and, by extension, in Lean Six Sigma projects. It quantifies the strength of the evidence against a null hypothesis in a statistical test. In simpler terms, it helps you determine if the results you observe in a sample can be generalized to a larger population. The P-Value ranges from 0 to 1, with lower values typically signaling that the observed data is unlikely under the null hypothesis. This often leads practitioners to reject the null hypothesis in favor of the alternative hypothesis.
Importance in Statistical Analysis
In Lean Six Sigma, rigorous statistical analysis is non-negotiable. Decisions must be data-driven, not based on gut feelings or anecdotal evidence. The P-Value serves as a crucial metric in this regard. It helps Lean Six Sigma practitioners make informed decisions by evaluating the statistical significance of the data. If you’re looking to make improvements in a business process, it’s not enough to observe a change; you need to know how significant that change is. The P-Value helps you make that determination.
Brief Mention of Hypothesis Testing
Hypothesis testing is the process of using statistical methods to make inferences or predictions about a population based on a sample. It serves as the backbone for most statistical analyses in Lean Six Sigma projects. The P-Value plays a central role in this, providing a quantitative measure to help you decide whether to reject or fail to reject the null hypothesis. Understanding the P-Value is, therefore, integral to the robustness and reliability of your hypothesis testing efforts.
The Pillars of Lean Six Sigma
Lean Six Sigma is a methodology aimed at improving business processes by combining the principles of Lean and Six Sigma. While Lean focuses on reducing waste and streamlining operations, Six Sigma emphasizes reducing variation and improving quality. To successfully deploy these principles, practitioners often use a structured approach known as DMAIC, an acronym that stands for Define, Measure, Analyze, Improve, and Control. Below, we explore this framework in more detail and examine the role P-Value plays within it.
Define DMAIC (Define, Measure, Analyze, Improve, Control)
- Define: This is where you articulate the problem that needs to be solved. You’ll establish objectives, identify stakeholders, and delineate the scope of your project.
- Measure: In this phase, data collection takes center stage. You’ll quantify the current state of the process you’re looking to improve and establish a baseline for comparison.
- Analyze: Data collected in the Measure phase is rigorously examined here to identify the root cause(s) of the problem. Statistical methods, including hypothesis testing, are crucial at this stage.
- Improve: Based on your analysis, you’ll design and implement solutions. This is a creative and collaborative phase, with the focus on making targeted changes for improvement.
- Control: The final step involves ensuring the gains made in the Improve phase are sustained. Control charts and other statistical methods are employed to monitor the improved process over time.

Explain Where P-Value Fits within DMAIC
- Define: While P-Value is not directly used in this phase, the groundwork for future data collection and hypothesis testing is laid, making it crucial for later stages where P-Value comes into play.
- Measure: Again, P-Value doesn’t play a direct role here but preparing the data for statistical analysis sets the stage for its eventual calculation and interpretation.
- Analyze: This is where the P-Value shines. The data is put to the test—literally—through hypothesis testing. The P-Value helps in deciding whether the observed data is statistically significant, guiding the decision-making process.

- Improve: The insights gained from the P-Value guide the improvements to be made. If a low P-Value is observed, it may mean that a significant improvement is possible, prompting action.
- Control: Here, P-Value can be used in ongoing quality control, particularly in control charts that are used to monitor the process over time. The P-Value helps in detecting outliers and shifts in the process, enabling timely corrective actions.
How P-Value is Used in Each Phase of DMAIC
Understanding the intricate role of P-Value in a Lean Six Sigma project involves exploring its applicability across the DMAIC framework. Let’s take a closer look at how P-Value interfaces with the first two phases—Define and Measure.
Define Phase
Ironically, in the Define phase of a Lean Six Sigma project, the P-Value typically has no direct role. This phase is more about qualitative than quantitative analysis. The objective here is to clearly articulate the problem, identify key stakeholders, and establish the scope and objectives of the project. You’re essentially laying the groundwork for future statistical analysis by deciding what metrics are important and how they should be measured. So, while you won’t be calculating any P-Values in this phase, the decisions you make will significantly impact how P-Values will be utilized in subsequent phases.
Measure Phase
In the Measure phase, you’re still not dealing with P-Values directly, but the work done here is crucial for the phases where the P-Value will become central. Let’s break down the measurement phase into two key components:
Setting Up Data Collection Strategies
In this stage, you’re establishing what data needs to be collected to properly evaluate the problem at hand. You’ll need to set up sampling strategies, choose measuring instruments, and ensure the reliability and validity of your data collection methods. All these factors contribute to the robustness of the P-Value that you’ll eventually calculate. Inaccurate or biased data can lead to misleading P-Values, which is why meticulous planning in this phase is critical.
Preparing for Future Hypothesis Testing
Once you’ve established how you’re going to collect the data, you also need to prepare for how you’ll use it in hypothesis testing during the Analyze phase. You’ll define your null and alternative hypotheses, set alpha levels (the threshold for determining statistical significance), and prepare the statistical tests you intend to use. All these decisions have a direct impact on the P-Value that you’ll eventually compute and interpret. Essentially, your planning here sets the stage for the meaningful utilization of P-Values in the Analyze phase.
After laying the groundwork in the Define and Measure phases, the Analyze, Improve, and Control phases are where P-Values really come into play. Let’s explore each in detail:
Analyze Phase
In the Analyze phase, you’ll delve into the data collected, focusing on identifying root causes and substantiating your findings through hypothesis testing.

Introduction to Hypothesis Testing
Hypothesis testing serves as a cornerstone of statistical analysis in Lean Six Sigma. It allows you to make inferences about a population based on your sample data. In essence, you’re trying to refute a null hypothesis in favor of an alternative hypothesis. This is where the P-Value becomes invaluable.
How P-Value is Calculated
P-Value is calculated using various statistical tests such as t-tests, chi-square tests, or ANOVA, depending on your specific use-case and data type. These tests yield a P-Value that represents the probability of obtaining the observed results, or more extreme ones, when the null hypothesis is true.
If you are looking to Analyze the P-Value of your data, check out our P-Value Analyzer

Interpretation of P-Value Results
A smaller P-Value (usually less than 0.05) suggests that you can reject the null hypothesis, indicating that your observations are statistically significant. On the other hand, a larger P-Value suggests that you fail to reject the null hypothesis, meaning the observed results are not statistically significant.

Case Study: Real-world example of P-Value in action during the Analyze Phase
Imagine a manufacturing firm wants to improve the longevity of its product. After collecting data and setting up hypotheses, the P-Value is found to be 0.02. This indicates strong evidence against the null hypothesis, implying that the implemented change could significantly improve product longevity.
Improve Phase
How P-Value Results Influence Improvement Strategies
In the Improve phase, the results of your P-Value calculations guide your improvement strategies. A low P-Value might signify that a particular change is likely to have a significant impact, encouraging the implementation of that change.
Examples of Actions Taken Based on P-Value Interpretation
For instance, if you find a low P-Value when testing a new supplier’s material quality, you might decide to switch suppliers to improve product quality.
Control Phase
Using P-Value for Ongoing Quality Control
In the Control phase, P-Values can be recalculated periodically to ensure that improvements are sustained over time. This is an ongoing effort to monitor process stability and performance.
The Role of P-Value in Statistical Process Control (SPC) Charts
Statistical Process Control (SPC) charts are used to monitor the consistency of processes over time. P-Value can play a role here by identifying any outliers or shifts in the process, allowing for timely corrective actions. For example, a sudden spike in P-Values in your SPC charts might indicate a need for immediate investigation and potential process adjustments

Common Pitfalls and How to Avoid Them
Utilizing P-Value in Lean Six Sigma is powerful but can be fraught with potential pitfalls if not done carefully. The following are some common challenges along with ways to sidestep them:
Misinterpretation of P-Value
The Problem
One of the most common issues is misinterpreting what the P-Value actually means. People often mistake a low P-Value as an indicator of the ‘size’ or ‘importance’ of an effect, which is not the case. A low P-Value simply means that the result is statistically significant, not necessarily practically significant.
The Solution
Always pair your P-Value with other statistical measures like confidence intervals, effect size, or the practical significance of the result to the business process you’re investigating. This provides a more rounded view of what the data is truly saying.
P-Hacking: Manipulating Variables to Get a Desired P-Value
The Problem
P-Hacking refers to the practice of manipulating your experiment or data until you get a P-Value that is statistically significant (usually below 0.05). This is highly misleading and essentially nullifies the validity of your findings.
The Solution
To avoid this, always define your hypothesis and alpha level (significance level) before you begin your data collection and stick to them. Resist the temptation to stop collecting data as soon as you reach a desirable P-Value or to add more variables that were not in the original plan.
Importance of Context When Interpreting P-Value
The Problem
P-Values do not operate in a vacuum. The same P-Value can mean different things in different contexts. For instance, a P-Value of 0.04 may be groundbreaking in a field like medical research but inconsequential in a manufacturing setting where much lower P-Values are commonly achieved.
The Solution
Always interpret your P-Value in the context of your specific industry, the existing literature, and the practical implications for the process you are investigating. This contextual understanding enhances the reliability of your conclusions.
Conclusion
Understanding the role of P-Value in Lean Six Sigma is vital for any practitioner aiming to master the art and science of continuous improvement. From its peripheral yet foundational role in the Define and Measure phases, to its pivotal applications in Analyze, Improve, and Control phases, the P-Value serves as a statistical compass guiding your decision-making process. However, like any tool, it is not without its pitfalls.
Misinterpreting its significance or manipulating variables to attain a desirable P-Value can easily derail your project and lead to misguided conclusions. By approaching P-Value with the rigor and context it demands, you can sidestep these common pitfalls and harness its full potential to drive meaningful, sustainable improvements in your organization. As you continue your Lean Six Sigma journey, let this understanding of P-Value be your statistical north star, helping you navigate through complexities towards operational excellence.
References
- Thiese, M.S., Ronna, B. and Ott, U., 2016. P value interpretations and considerations. Journal of thoracic disease, 8(9), p.E928.
