Process Performance (Pp and Ppk) Index
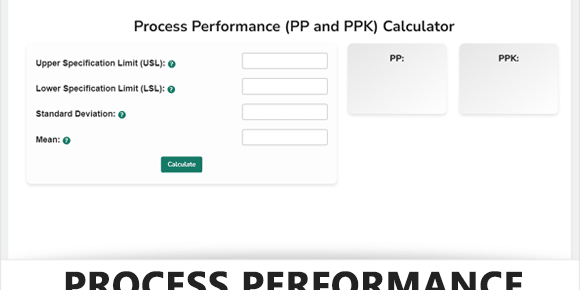
The Process Performance Calculator is a numerical tool designed to assess the capability of a process through the calculation of PP and PPK indices. By inputting key parameters such as Upper and Lower Specification Limits, Standard Deviation, and Mean, the calculator evaluates how consistently a process operates within specification limits. The resulting PP and PPK values serve as indicators of process efficiency and are useful for identifying areas that may require attention for improvement. The calculator is particularly valuable for organizations aiming to reduce variability and defects in their processes.
Looking to Calculate Process Capability (CP and CPK) Use our Process Capability Calculator
Process Performance (Pp and Ppk) Calculator
Pp:
Ppk:
Steps to Use the Calculator
1. Navigate to the Calculator
Locate the calculator on the webpage. You should see input fields for Upper Specification Limit (USL), Lower Specification Limit (LSL), Standard Deviation, and Mean.
2. Understand the Parameters
Before proceeding, it’s essential to know what each parameter means:
- Upper Specification Limit (USL): The maximum acceptable value for the process output.
- Lower Specification Limit (LSL): The minimum acceptable value for the process output.
- Standard Deviation: A statistical measure indicating the amount of variation in the process.
- Mean: The average value of the process output.
3. Input Data
Input your process data into the respective fields:
- USL: Enter the Upper Specification Limit.
- LSL: Enter the Lower Specification Limit.
- Standard Deviation: Enter the Standard Deviation of the process.
- Mean: Enter the Mean or average value of the process output.
4. Perform the Calculation
Click on the “Calculate” button. The calculator will instantly compute the PP and PPK values.
5. Interpret Results
The calculator will display the PP and PPK indices, which serve as measures of your process capability.
- PP: Indicates the inherent variability of the process in relation to the specification limits.
- PPK: Takes into account both the process variability and its central tendency, making it a more comprehensive indicator.
6. Take Action
Based on the PP and PPK values, assess whether your process needs improvement. Lower values often indicate that the process may require attention to minimize variability and defects.
Process Performance (PP)
The Process Performance (PP) is a statistical measure that quantitatively indicates the inherent variability of a process in relation to its specification limits. In other words, PP tells you how well your process would meet specifications if it were centered perfectly between the Lower Specification Limit (LSL) and Upper Specification Limit (USL).
The formula for PP is:
Here, the USL and LSL are the upper and lower bounds for what is considered an acceptable outcome for the process. The standard deviation measures the variability within the process.
Interpretation of PP
- PP < 1: Indicates that the process is not capable, and improvements are necessary.
- PP = 1: Signifies that the process is just meeting its specifications.
- PP > 1: Indicates the process is capable and provides room for potential drifts in the process mean.
Process Performance Index (PPK)
While PP assumes that the process mean is perfectly centered between the specification limits, PPK takes into account the actual position of the mean and thus provides a more realistic picture of the process capability. PPK considers both the process variability and the process’s ability to meet its specifications.
The formula for PPK is:
Interpretation of PPK
- PPK < 1: Indicates that the process is not capable and needs improvement.
- PPK = 1: Shows that the process just meets its specifications.
- PPK > 1: Indicates a capable process, where the mean and the variability are well within the specification limits.
Key Differences
- PP only considers the inherent variability of the process, assuming that the process is centered between the LSL and USL.
- PPK takes into account the actual position of the process mean, making it a more realistic measure of process capability.
In summary, both PP and PPK are crucial metrics for understanding the capability of a process, but they are used in slightly different contexts. PP is more of an idealistic measure, while PPK provides a realistic picture.
Process Performance Index Interpretation Table
| Metric | Range | Interpretation |
|---|---|---|
| PP | < 1 | Process is not capable. Improvement is necessary to meet specifications. |
| = 1 | Process is just meeting its specifications. There’s no room for error. | |
| > 1 | Process is capable. It can produce outputs within specifications even if there are slight shifts in the process mean. | |
| PPK | < 1 | Process is not capable. Both the mean and variability need to be improved. |
| = 1 | Process just meets its specifications. Any slight shift could lead to defects. | |
| > 1 | Process is capable. The mean and variability are well within the specification limits. |
Useful Templates
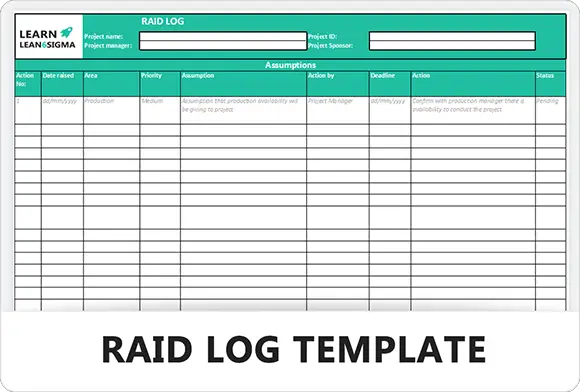
RAID Log Template
RAID Log Excel Template Our RAID Log template, which is free to download, is a simple and effective solution for…
DMAIC Project Report Template
DMAIC Project Excel Template Download our Free Microsoft Excel Lean Six Sigma DMAIC Project Template. The project report template covers…
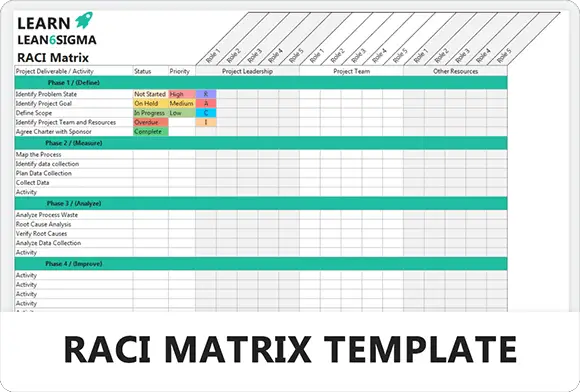
RACI Matrix Template
RACI Matrix Excel Template Our RACI Matrix template for Excel! This free to download template will help you easily define…


