
How to use the DPMO Calculator:
1. Input Defects, Units, and Defect Opportunities per Unit:
- In the calculator section, you will find three input fields labeled “Defects,” “Units,” and “Defect Opportunities per Unit.”
Enter the number of defects found in your process in the “Defects” field. - Enter the total number of units produced in your process in the “Units” field.
Enter the number of defect opportunities for each unit in the “Defect Opportunities per Unit” field. This represents the potential number of defects in each unit.
2. Click the “Calculate” Button:
- After entering the required information, click the “Calculate” button located next to the input fields.
3. Observe the Results:
- The DPMO (Defects Per Million Opportunities) and Sigma Level results will be displayed in two boxes below the calculator section.
- The DPMO result represents the calculated defects per million opportunities.
- The Sigma Level result represents the process sigma level, indicating the process performance.
4. Interpret the Sigma Level Result:
- Based on the calculated DPMO value, the Sigma Level result provides an assessment of process performance.
- A higher Sigma Level indicates superior process performance, whereas a lower Sigma Level indicates inferior performance.
- The outcome is color-coded for ease of interpretation. Green indicates excellent performance, yellow moderate performance, and red poor performance.
5. Review Additional Information (Optional):
- Additional information about the corresponding Sigma Level can be found below the results. This data provides insight into the process’s quality and dependability.

What is DPMO?
DPMO stands for “Defects Per Million Opportunities.” It is a metric used to assess the quality of a process or system. Consider a manufacturing process or any other activity where defects could occur. These flaws or mistakes could be mistakes, errors, or flaws in the final product or outcome.
The DPMO calculates the number of defects that occur for every million chances for defects to occur. The term “opportunities” refers to the total number of possibilities for a defect to occur in each unit or product.
For example, let’s say you are producing computer chips, and each chip has multiple components that could potentially be defective. If you make one million chips and find 50 flaws, your DPMO is 50. It translates to 50 defects per million chip components manufactured.
DPMO is an important quality management metric because it allows us to compare the quality of various processes or systems. A lower DPMO value indicates higher quality because there are fewer defects in comparison to the chances of defects occurring. A higher DPMO value, on the other hand, indicates a higher defect rate and suggests that the process needs to be improved to reduce defects and improve overall quality.
DPMO Conversion Table
The DPMO to Sigma Level Conversion Table is a useful tool for quickly understanding the relationship between process quality and Sigma Levels. DPMO stands for “Defects Per Million Opportunities,” and it calculates the defect rate for each million chances for a defect to occur in a process. Sigma Level, on the other hand, is a measure of process performance that represents a process’s standard deviation in relation to its specification limits.
The table shows the DPMO values for various Sigma Levels, rounded to 0 decimal places. The DPMO values decrease as the Sigma Level increases, indicating better process performance and a lower defect rate and higher quality. This data is priceless for quality management because it enables organizations to set improvement goals, optimize processes, and achieve higher levels of efficiency and customer satisfaction.
| Sigma Level | DPMO (Defects Per Million Opportunities) | Percentage of Defects (%) |
|---|---|---|
| 1 | 691,462 | 69.15% |
| 2 | 308,538 | 30.85% |
| 3 | 66,807 | 6.68% |
| 4 | 6,210 | 0.62% |
| 5 | 233 | 0.023% |
| 6 | 3.4 | 0.00034% |


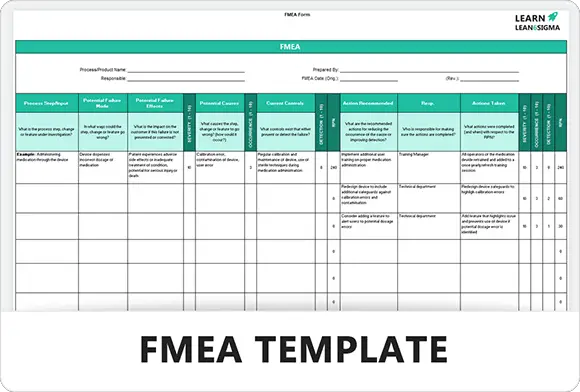
FMEA Template – Failure Modes Effect Analysis
Download the comprehensive FMEA (Failure Modes and Effects Analysis) template to systematically evaluate and mitigate risks in your projects, ensuring…
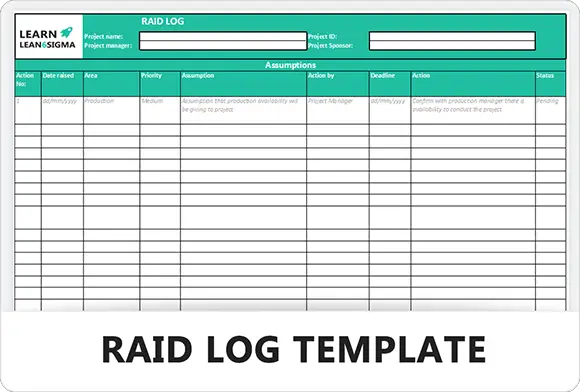
RAID Log Template
RAID Log Excel Template Our RAID Log template, which is free to download, is a simple and effective solution for…
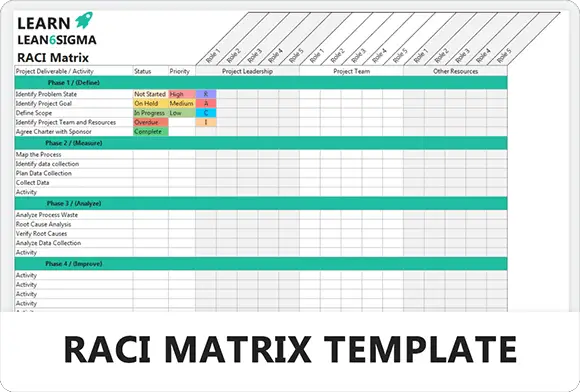
RACI Matrix Template
RACI Matrix Excel Template Our RACI Matrix template for Excel! This free to download template will help you easily define…